Graphite & Riemann
There are several ways of collecting runtime metrics out of your software. We’ve discussed of Munin or Datadog already, we could talk about Collectd as well, although these solutions would mostly aim at system monitoring, as opposed to distributed systems.
Business Intelligence may require collecting metrics from a cluster of workers, aggregating them into comprehensive graphs, such as short-living instances won’t imply a growing collection of distinct graphs.
Riemann is a Java web service, allowing to collect metrics over TCP or UDP, and serving with a simple web interface generating dashboards, displaying your metrics as they’re received. Configuring Riemann, you would be able to apply your input with transformations, filtering, … You may find a quickstart here, or something more exhaustive over there. A good starting point could be to keep it simple:
(logging/init {:file “/var/log/riemann/riemann.log”})
(let [host “0.0.0.0”]
(tcp-server {:host host})
(ws-server {:host host}))
(periodically-expire 5)
(let [index (index)] (streams (default :ttl 60 index (expired (fn [event] (info “expired” event))))))
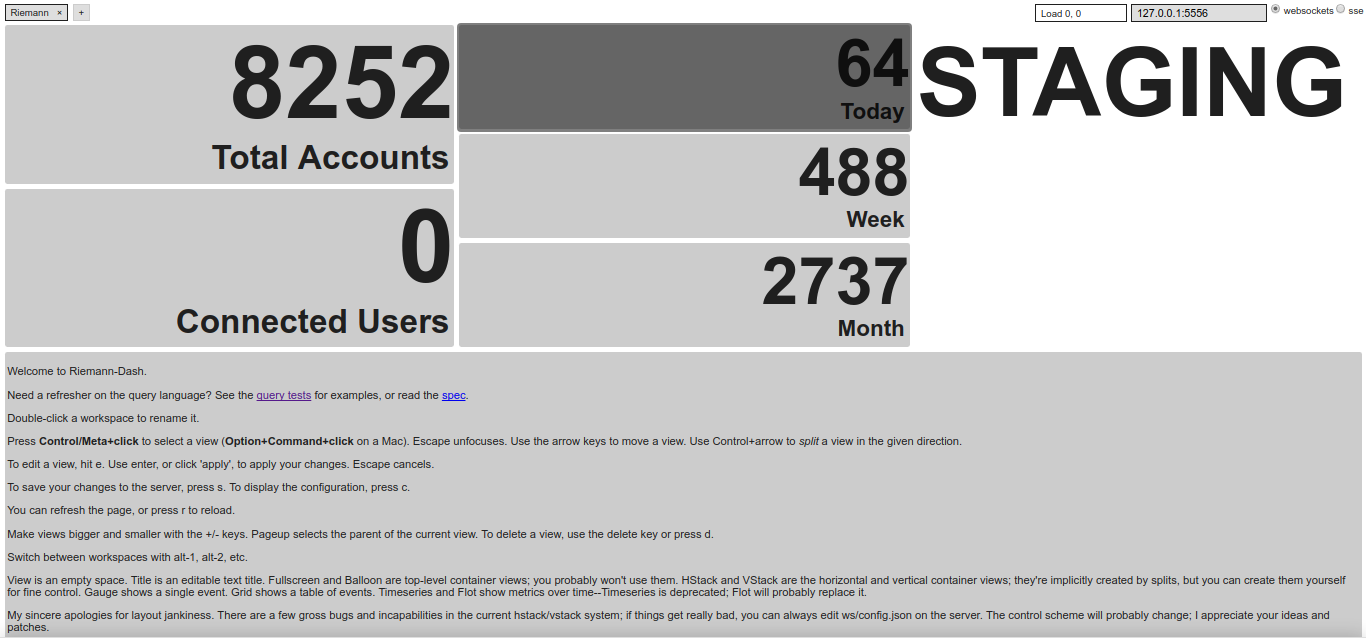
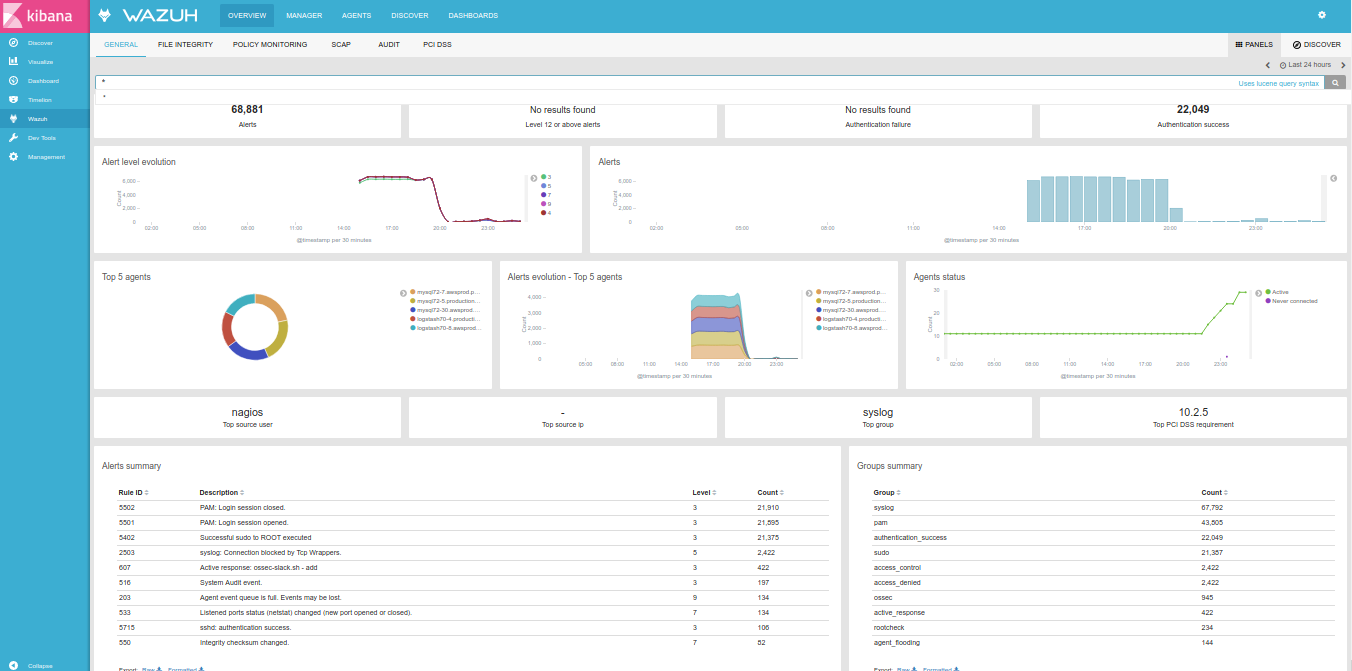
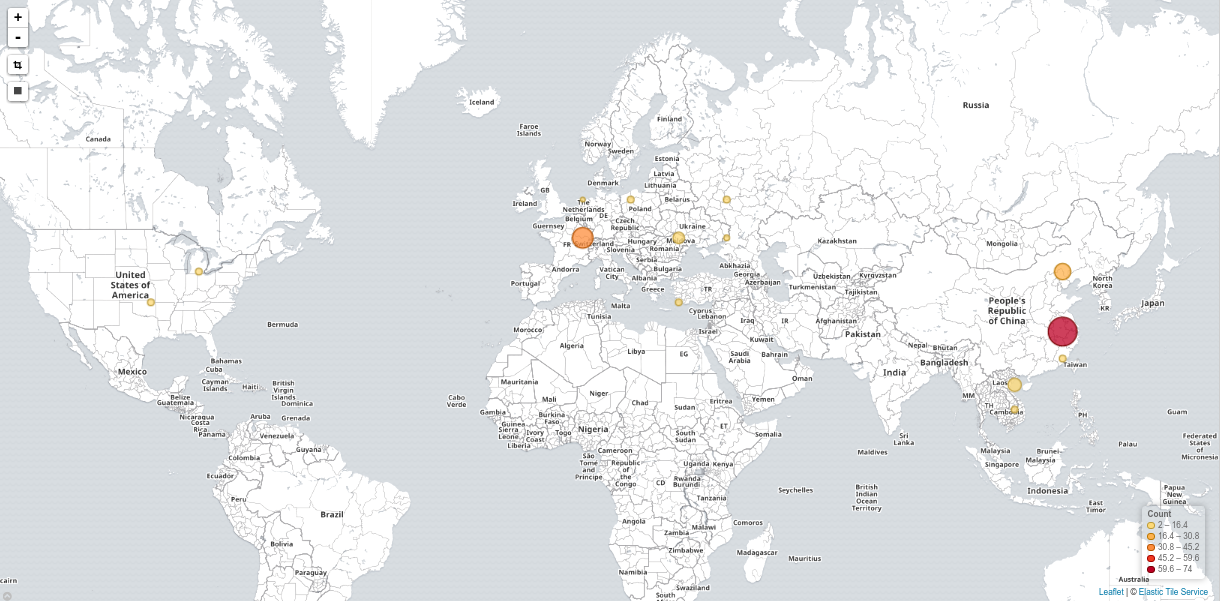
Riemann Sample Dashboard
Despite being usually suspicious of Java applications or Ruby web services, I tend to trust Riemann even under heavy workload (tens of collectd, forwarding hundreds of metrics per second).
Riemann Dashboard may look unappealing at first, although you should be able to build your own monitoring screen relatively easily. Then again, this would require a little practice, and some basic sense of aesthetics.
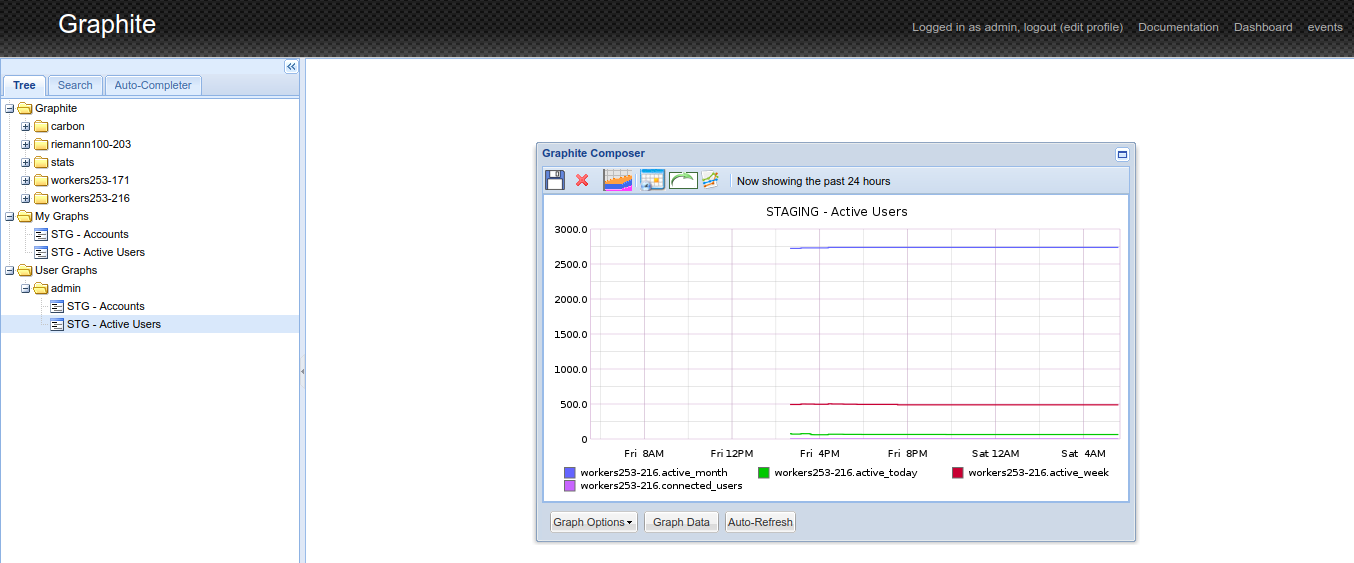
Graphite Composer
Graphite is a Python web service providing with a minimalist yet pretty powerful browser-based client, that would allow you to render graphs. Basic Graphite setup would usually involve some SQlite database storing your custom graphs and users, as long as another Python service: Carbon, storing metrics. Such setup would usually also involve Statsd, a NodeJS service listening for metrics, although depending on what you intend to monitor, you might find your way into writing to Carbon directly.
Setting up Graphite on Debian Stretch may be problematic, due to some python packages being deprecated, while the last Graphite packages aren’t available yet. After unsuccessfully trying to pull copies from PIP instead of APT, I eventually ended up setting my first production instance based on Devuan Jessie. Setup process would drastically vary based on distribution, versions, your web server, Graphite database, … Should you go there: consider all options carefully before starting.
Graphite could be used as is: the Graphite Composer would let you generate and save graphs, aggregating any collected metric, while the Dashboard view would let you aggregate several graphs into a single page. Although note you could use Graphite as part of Grafana as well, among others.
From there, note Riemann can be reconfigured forwarding everything to Graphite (or using your own filters), adding to your riemann.config:
(def graph (graphite {:host “10.71.100.164”}))
(streams graph)
This should allow you to run Graphite without Statsd, having Riemann collecting metrics from your software and forwarding them into Carbon.
The next step would be to configure your applications, forwarding data to Riemann (or Statsd, should you want to only use Graphite). Databases like Cassandra or Riak could forward some of their own internal metrics, using the right agent. Or, collecting BI metrics from your own code.
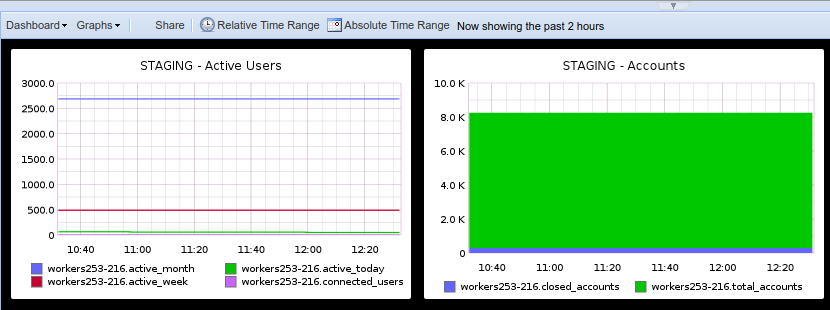
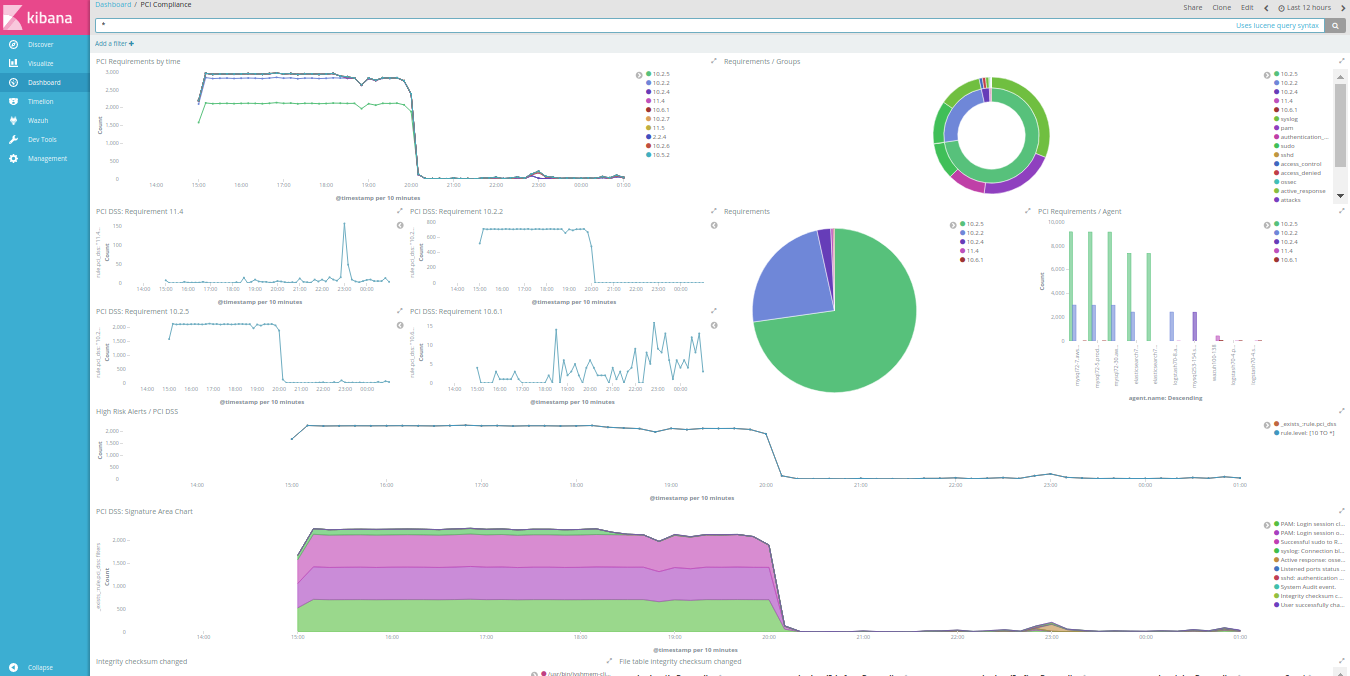
Graphite Dashboard
Using NodeJS, you will find a riemannjs module that does the job. Or node-statsd-client, for Statsd.
Having added some scheduled tasks to our code, querying for how many accounts we have, how many are closed, how many were active during the last day, week and month, … I’m eventually able to create a dashboard based on saved graphs, aggregating metrics in some arguably-meaningful fashion.