Icinga2
Before talking about Icinga, we might need to introduce Nagios: a popular monitoring solution, released in 1999, which became a standard over the years. The core concept is pretty simple: alerting upon services failure, according to user-defined check commands, schedules, notification and escalation policies.
You’ll find Nagios clients on pretty much all systems – meaning Windows. You may use SNMP to check devices or receive SNMP traps. You may use passive or active checks. You’ll probably stumble upon NRPE, Nagios Remote Plugin Executor and/or NSCA, Nagios Service Check Acceptor.
You’ve got the idea: Nagios is pretty modular. Writing plugins is relatively easy. Monitoring your infrastructure is made relatively easy, and you may automate pretty much everything using puppet classes or ansible roles.
Still, around 2009, two forks appeard: Icinga and Shinken, released in march and december respectively.
It could be a coincidence, though it most likely was the result of several disputes opposing Nagios Core contributors and developpers to the project maintainer, Ethan Galstad.
We won’t feed that troll, you may find more data about that over here.
Anyway, in early 2009, Icinga came out. Quickly after, Shinken joined them.
Both products advertised you may migrate your whole monitoring infrastructure from Nagios, just by stopping nagios daemon and starting either Shinken or Icinga one, using pretty much the same configuration.
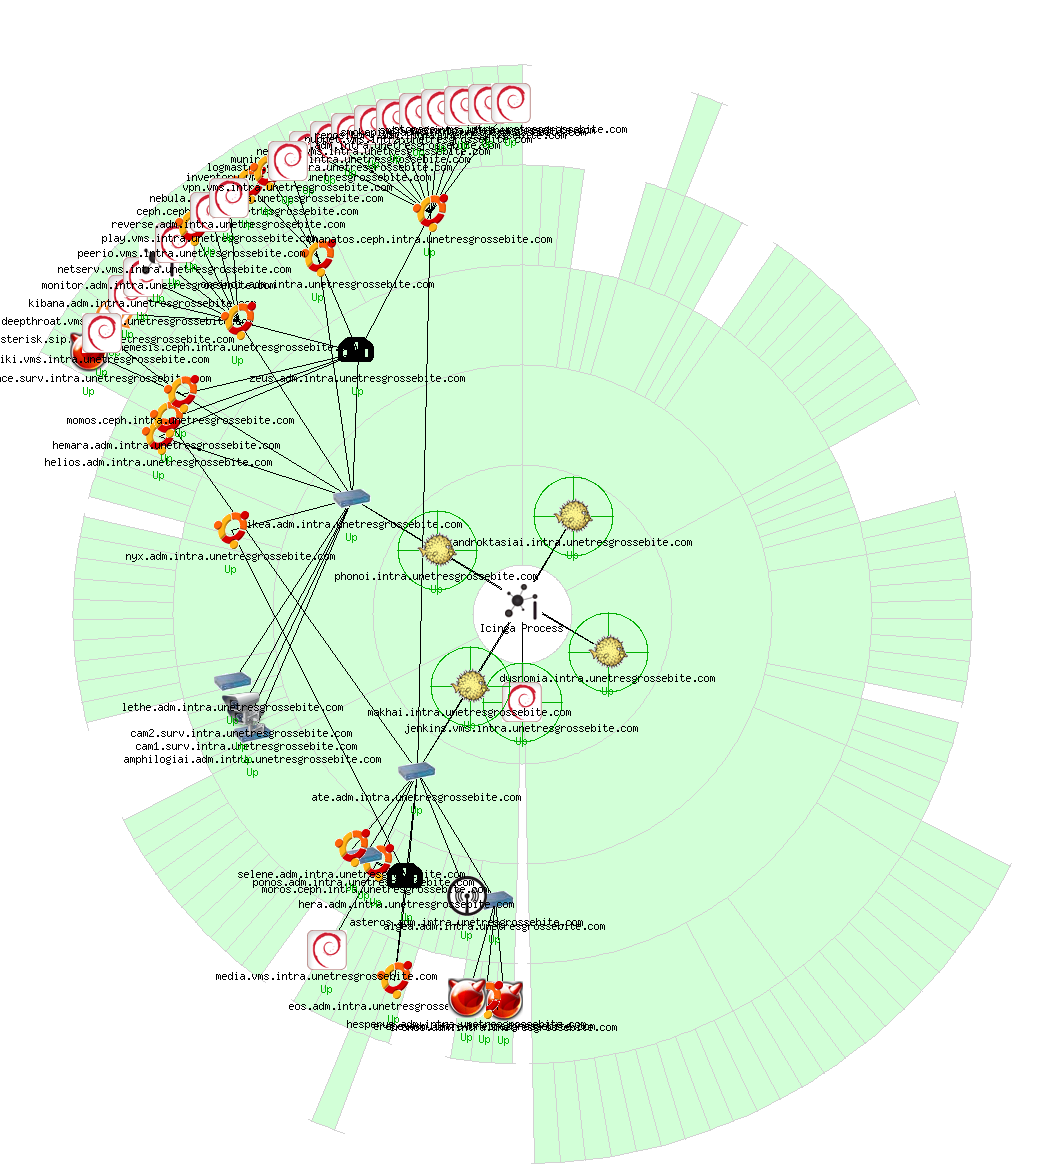
Icinga1.11 monitoring intra.unetresgrossebite.com
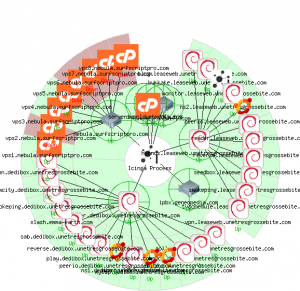
Icinga1.11 monitoring unetresgrossebite.com public services, as well as some of my customers services
So far, so good.
I’ve used Shinken once, a little less than a year. I wasn’t very much satisfied – too many workers, inducing some overhead, not really relevant for a small infrastructure like mine. It’s not really our topic. Meanwhile, I’ve been using Icinga for a couple years, I’ve installed tens of them, starting with version 1.7 to 1.9, working for Smile. All in all, I’m pretty satisfied. I’m still running a couple Icinga monitoring my own services, it’s nice, they have a web interface that does not require you to install some SGBD (for some reason, included in icinga-doc package on debian).
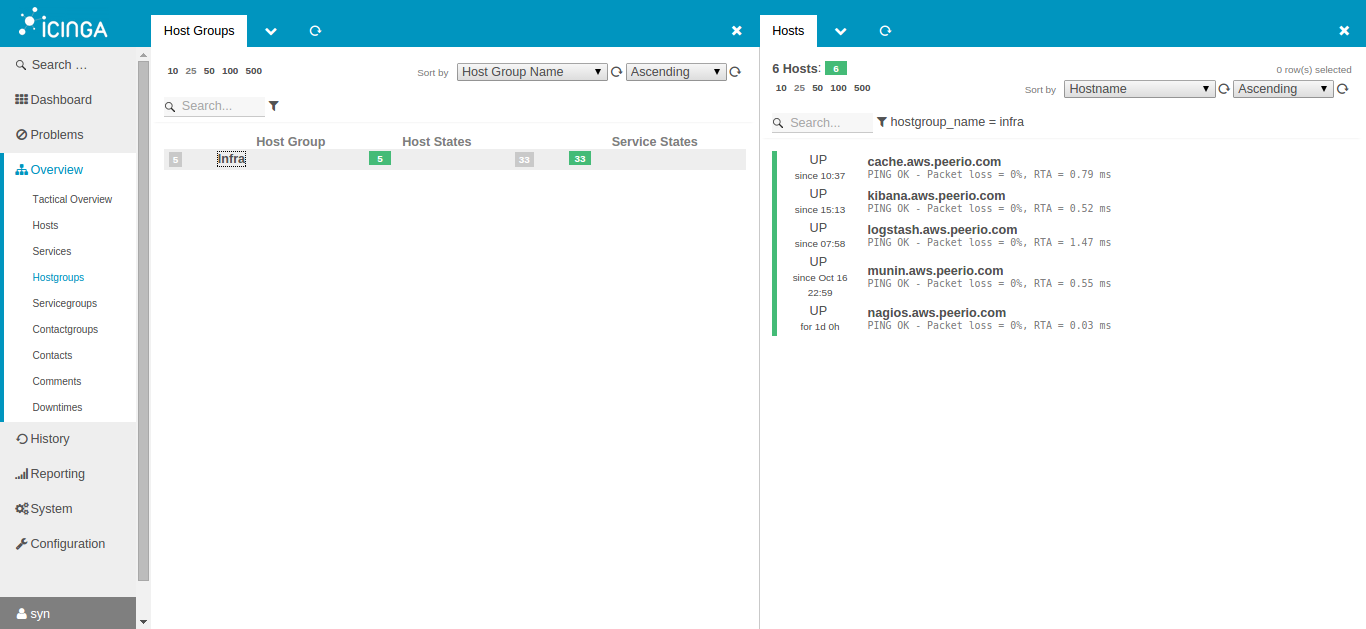
Icinga2 & Icingaweb2 monitoring aws.peerio.com
A while ago, Icinga released Icinga2. Sounded promising, until I realized they completely changed the way to configure their server, making my current templates and puppet classes useless.
Arguably, Icinga2 is not a nagios server anymore. Which is not necessarily a criticism.
This week, working on AWS for Peerio, I installed my first Icinga2 setup, writing ansible roles to automate NRPE servers configuration, Icinga2 configuration and probes registration to my nagios servers, SMS alerts using Twilio, mail alerts using sendgrid, using http proxies everywhere – no direct internet access, on AWS private instances.
There’s no public link to my gitlab, exceptionally, though I expect the repository to be opened to the public pretty soon on github.

Icinga2 Alert Summary
Point being, I’ve finally seen what Icinga2 is worth, and it’s pretty satisfying.
Upgrading from your former nagios server will be relatively more complicated than migrating from Nagios to Icinga, or Nagios to Shinken. You’ll probably want to start from a fresh VM, starting from scratch.
Icinga2 configuration could look strange, especially after using nagios syntax for years, but it makes sense, and could drastically reduce the amount of configuration you’ll need.
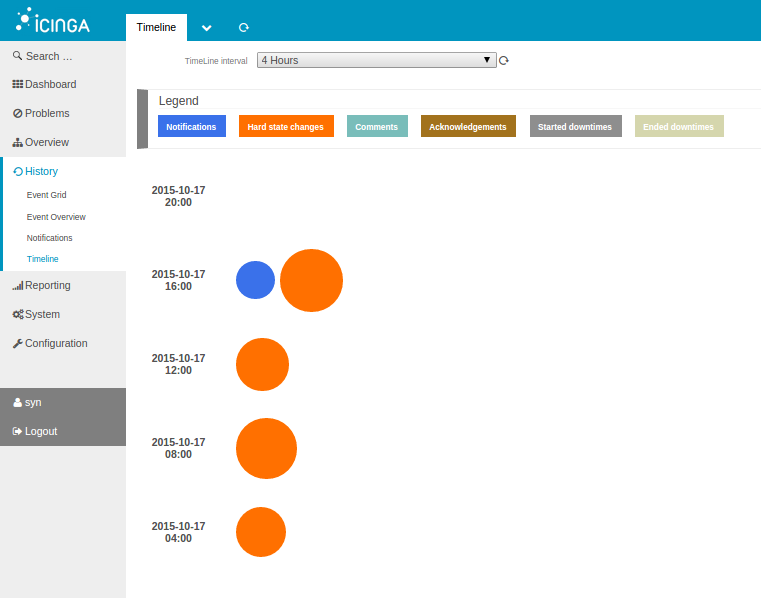
Icinga2 Timeline
I’m a little less convinced by their new web interface, Icingaweb2. For their defense, I had to download the code on github, the RC1 was released a few months ago. No bug so far, maybe some CSS stuff to fix (currently, the “Add New Pane or Dashboard” button is too small, I can only read half of the text), still pretty impressive for something pulled from github with no official packaged release.
I’m missing the statusmaps. The report interface looks sexier than in the previous version, though I can’t find how to generate detailed reports.
Looking at their “Timeline” view, I don’t remember seeing anything like that on their previous version. Why not.
The project is still young, I guess it could still be in some todolist. At least, the features represented work perfectly, their interface is pretty nice, pretty dynamic, without being some over-bloated list of tables like I was used to dealing with Shinken, Icinga or Thruk.