Fail2ban & ELK
Following up on a previous post regarding Kibana and ELK5 recent release, today we’ll follow up configuring some map visualizing hosts as Fail2ban blocks them.
Having installed Fail2ban and configured the few jails that are relevant for your system, look for Fail2ban log file path (variable logtarget, defined in /etc/fail2ban/fail2ban.conf, defaults to /var/log/fail2ban.log on debian).
The first thing we need is to have our Rsyslog processing Fail2ban logs. Here, we would use Rsyslog file input module (imfile), and force using FQDN instead of hostnames.
$PreserveFQDN on
module(load=”imfile” mode=”polling” PollingInterval=”10″)
input(type=”imfile”
File=”/var/log/fail2ban.log”
statefile=”/var/log/.fail2ban.log”
Tag=”fail2ban: ”
Severity=”info”
Facility=”local5″)
Next, we’ll configure Rsyslog forwarding messages to some remote syslog proxy (which will, in turn, forward its messages to Logstash). Here, I usually rely on rsyslog RELP protocol (may require installing rsyslog-relp package), as it addresses some UDP flaws, without shipping with traditional TCP syslog limitations.
Relaying syslog messages to our syslog proxy: load in RELP output module, then make sure your Fail2ban logs would be relayed.
$ModLoad omrelp
local5.* :omrelp:rsyslog.example.com:6969
Before restarting Rsyslog, if it’s not already the case, make sure the remote system would accept your logs. You would need to load Rsyslog RELP input module. Make sure rsyslog-relp is installed, then add to your rsyslog configuration
$ModLoad imrelp
$InputRELPServerRun 6969
You should be able to restart Rsyslog on both your Fail2ban instance and syslog proxy.
Relaying messages to Logstash, we would be using JSON messages instead of traditional syslog formatting. To configure Rsyslog forwarding JSON messages to Logstash, we would use the following
template(name=”jsonfmt” type=”list” option.json=”on”) {
constant(value=”{“)
constant(value=”\”@timestamp\”:\””) property(name=”timereported” dateFormat=”rfc3339″)
constant(value=”\”,\”@version\”:\”1″)
constant(value=”\”,\”message\”:\””) property(name=”msg”)
constant(value=”\”,\”@fields.host\”:\””) property(name=”hostname”)
constant(value=”\”,\”@fields.severity\”:\””) property(name=”syslogseverity-text”)
constant(value=”\”,\”@fields.facility\”:\””) property(name=”syslogfacility-text”)
constant(value=”\”,\”@fields.programname\”:\””) property(name=”programname”)
constant(value=”\”,\”@fields.procid\”:\””) property(name=”procid”)
constant(value=”\”}\n”)
}
local5.* @logstash.example.com:6968;jsonfmt
Configuring Logstash processing Fail2ban logs, we would first need to define a few patterns. Create some /etc/logstash/patterns directory. In there, create a file fail2ban.conf, with the following content:
F2B_DATE %{YEAR}-%{MONTHNUM}-%{MONTHDAY}[ ]%{HOUR}:%{MINUTE}:%{SECOND}
F2B_ACTION (\w+)\.(\w+)\[%{POSINT:pid}\]:
F2B_JAIL \[(?\w+\-?\w+?)\]
F2B_LEVEL (?\w+)\s+
Then, configuring Logstash processing these messages, we would define an input dedicated to Fail2ban. Having tagged Fail2ban events, we will apply a Grok filter identifying blocked IPs and adding geo-location data. We’ll also include a sample output configuration, writing to ElasticSearch.
input {
udp {
codec => json
port => 6968
tags => [ “firewall” ]
}
}filter {
if “firewall” in [tags] {
grok {
patterns_dir => “/etc/logstash/patterns”
match => {
“message” => [
“%{F2B_DATE:date} %{F2B_ACTION} %{F2B_LEVEL:level} %{F2B_JAIL:jail} %{WORD:action} %{IP:ip} %{GREEDYDATA:msg}?”,
“%{F2B_DATE:date} %{F2B_ACTION} %{WORD:level} %{F2B_JAIL:jail} %{WORD:action} %{IP:ip}”
]
}
}
geoip {
source => “ip”
target => “geoip”
database => “/etc/logstash/GeoLite2-City.mmdb”
add_field => [ “[geoip][coordinates]”, “%{[geoip][longitude]}” ]
add_field => [ “[geoip][coordinates]”, “%{[geoip][latitude]}” ]
}
mutate {
convert => [ “[geoip][coordinates]”, “float” ]
}
}
}output {
if “_check_logstash” not in [tags] and “_grokparsefailure” not in [tags] {
elasticsearch {
hosts => [ “elasticsearch1.example.com”, “elasticsearch2.example.com”, “elasticsearch3.example.com” ]
index => “rsyslog-%{+YYYY.MM.dd}”
}
}
if “_grokparsefailure” in [tags] {
file { path => “/var/log/logstash/failed-%{+YYYY-MM-dd}.log” }
}
}
Note that if I would have recommended using RELP inputs last year, running Logstash 2.3: as of Logstash 5 this plugin is no longer available. Hence I would recommend setting up some Rsyslog proxy on your Logstash instance, in charge of relaying RELP messages as UDP ones to Logstash, through your loopback.
Moreover: assuming you would need to forward messages over a public or un-trusted network, then using Rsyslog RELP modules could be used with Stunnel encapsulation. Whereas running Debian, RELP output with TLS certificates does not seem to work as of today.
That being said, before restarting Logstash, if you didn’t already, make sure to define a template setting geoip type to geo_point (otherwise shows as string and won’t be usable defining maps). Create some index.json file with the following:
{
“mappings”: {
“_default_”: {
“_all”: { “enabled”: true, “norms”: { “enabled”: false } },
“dynamic_templates”: [
{ “template1”: { “mapping”: { “doc_values”: true, “ignore_above”: 1024, “index”: “not_analyzed”, “type”: “{dynamic_type}” }, “match”: “*” } }
],
“properties”: {
“@timestamp”: { “type”: “date” },
“message”: { “type”: “string”, “index”: “analyzed” },
“offset”: { “type”: “long”, “doc_values”: “true” },
“geoip”: { “type” : “object”, “dynamic”: true, “properties” : { “location” : { “type” : “geo_point” } } }
}
}
},
“settings”: { “index.refresh_interval”: “5s” },
“template”: “rsyslog-*”
}
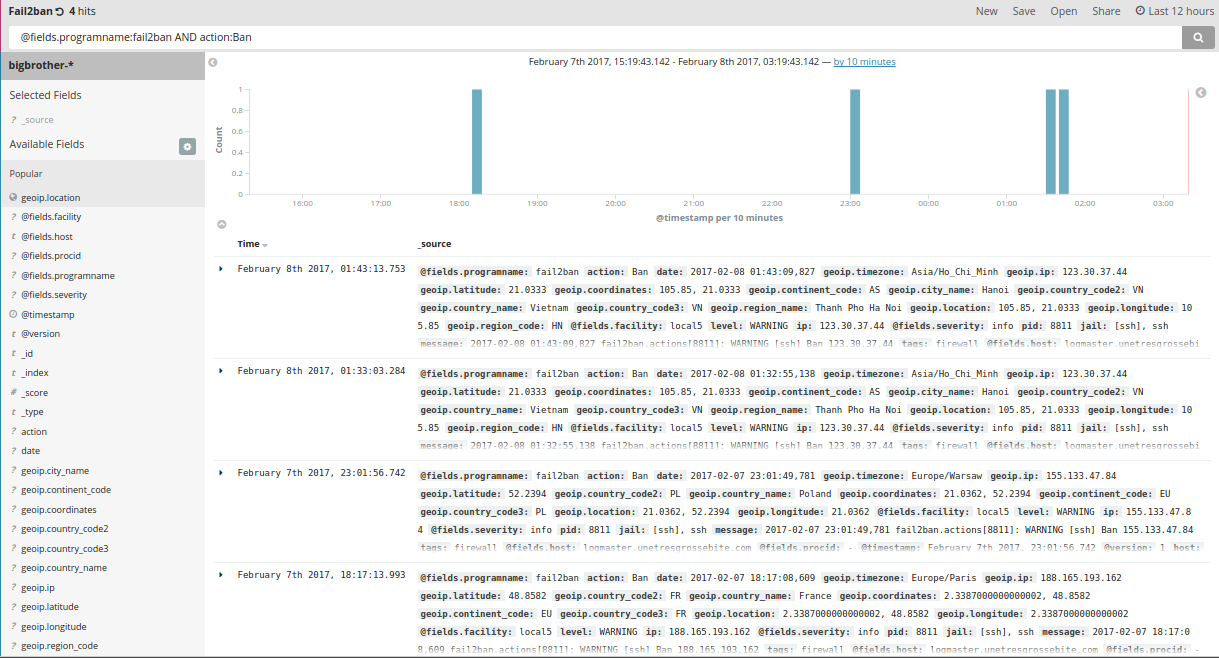
kibana search
Post your template to ElasticSearch
root@logstash# curl -XPUT http://elasticsearch.example.com:9200/_template/rsyslog?pretty -d@index.json
You may now restart Logstash. Check logs for potential errors, …
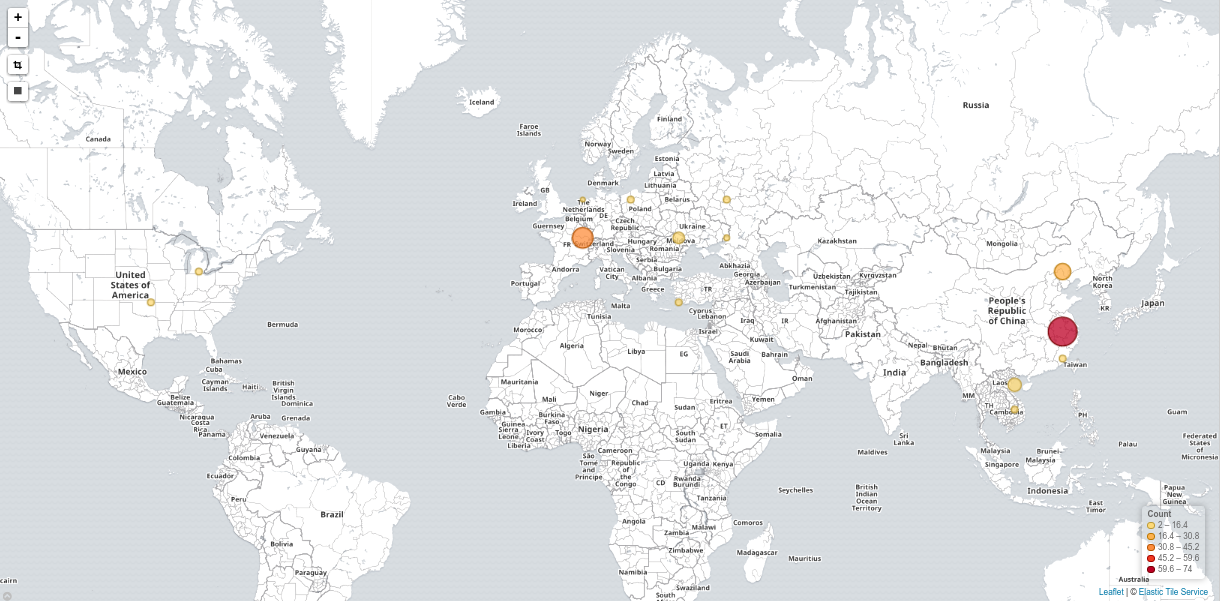
kibana map
Now to configure Kibana: start by searching for Fail2ban logs. Save your search, so it can be re-used later on.
Then, in the Visualize panel, create a new Tile Map visualization, pick the search query you just saved. You’re being asked to select bucket type: click on Geo Coordinates. Insert a Label, click the Play icon to refresh the sample map on your right. Save your Visualization once you’re satisfied: these may be re-used defining Dashboards.