Menu

Results for category "Consulting & Freelance"

28 Articles

Mesos

Today we would take a short break from Kubernetes, and try out another container orchestration solution: Mesos.

Mesos is based on a research project, first presented in 2009 under the name of Nexus. Its version 1 was announced in 2016 by the Apache Software Foundation. In April 2021, a vote concluded Mesos should be moved to the Apache Attic, suggesting it reached end of life, though that vote was later cancelled, due to increased interest.


A Mesos cluster is based on at least three components: a Zookeeper server (or cluster), a set of Mesos Master and the Mesos Slave agent, that would run on all nodes in our cluster. Which could be compared to Kubernetes etcd, control plane and kubelet respectively.

Setting it up, we would install Mesos Repository (on CentOS7: http://repos.mesosphere.io/el/7/noarch/RPMS/mesosphere-el-repo-7-1.noarch.rpm), then install the mesos package on all nodes, as well as mesosphere-zookeeper on the Zookeeper nodes.

Make sure /etc/mesos/zk points to your Zookeeper node(s).

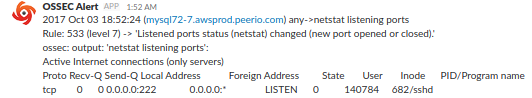
Open ports 2181/tcp on your Zookeeper nodes, port 5050/tcp on master nodes, and 5051/tcp on agents.

Start zookeeper, mesos-master and mesos-slave services.

We should be able to connect our Master console, on port 5050, and confirm our agents have properly registered.Mesos Agents


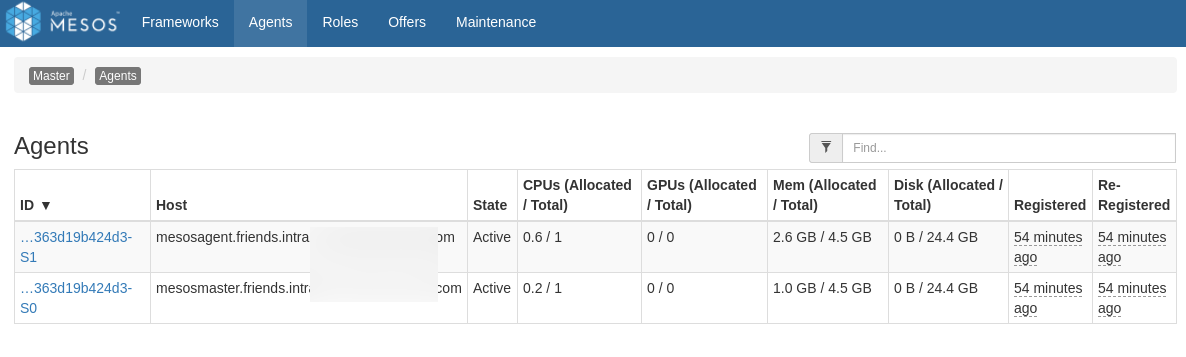
With Mesos, we are likely to first deploy some frameworks, that would then orchestrate our applications deployment.

Frameworks would take care of scheduling workloads on your behalf, using Mesos resources. The first one we should look into is Marathon, which could be compared to Kubernetes Deployment and StatefulSets controller, in that it would ensure an application is “always on”.

We may deploy Marathon on a separate node, or to an existing Mesos instance, installing the marathon package from the same repository we installed Mesos from. Note that CentOS7 default JRE seems to be an issue running Marathon latest releases: you may want to install marathon-1.4 instead.

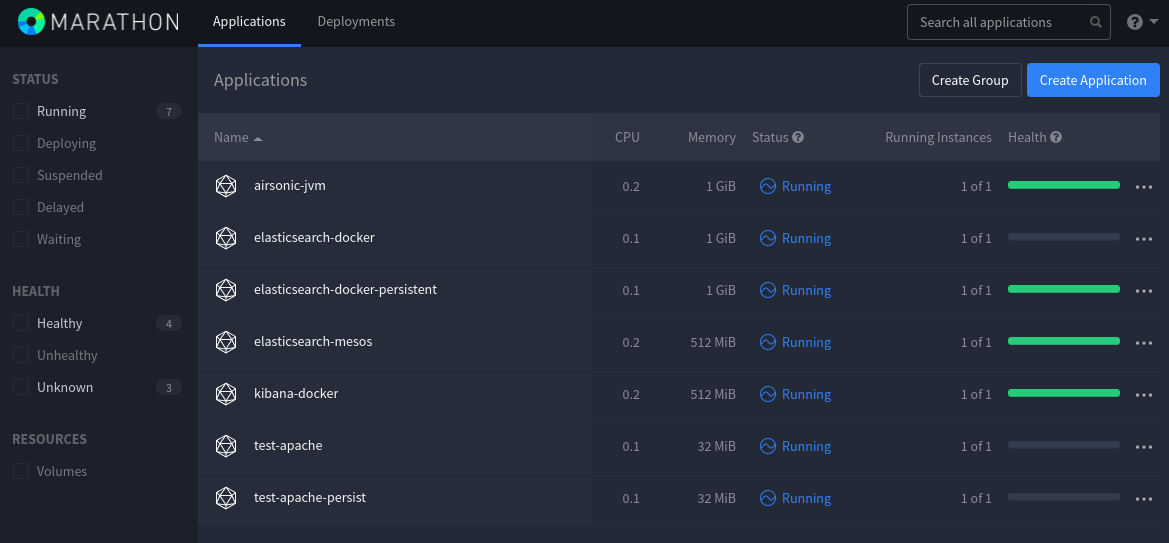
Marathon listens on port 8080/tcp, which should be opened as well. Having done so, we may connect the Marathon UI to deploy our applications – or POST json objects to its API.

Marathon

Now, we could look into what makes Mesos interesting, when compared with Kubernetes.

You may know Mesos can be used deploying Docker container, which would be done posting something like the following, to the Marathon API:

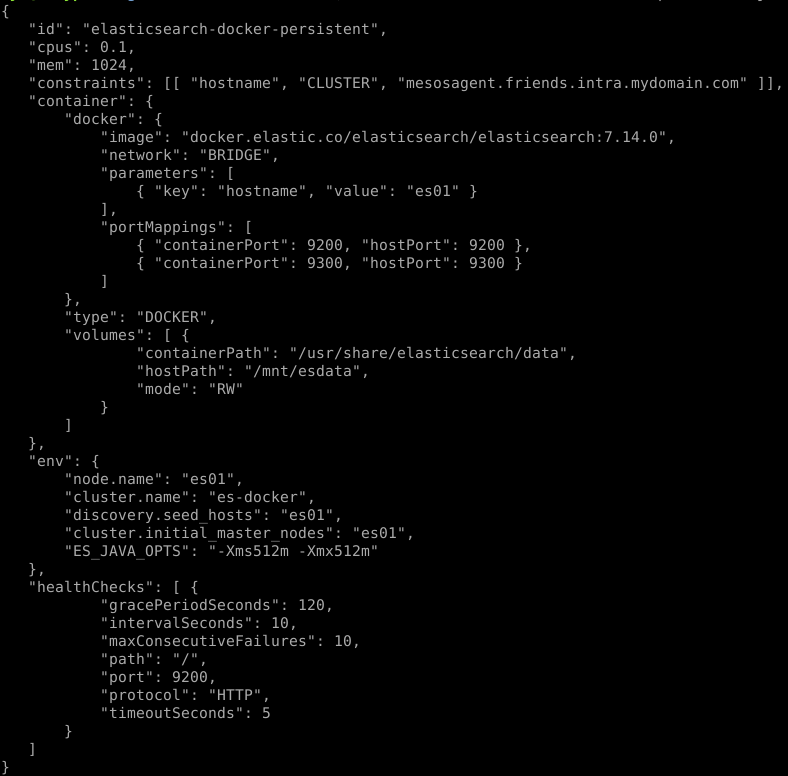
Though the above relies on the Docker runtime, which is not mandatory, using Mesos.

Indeed, we could describe the same deployment, with the following:

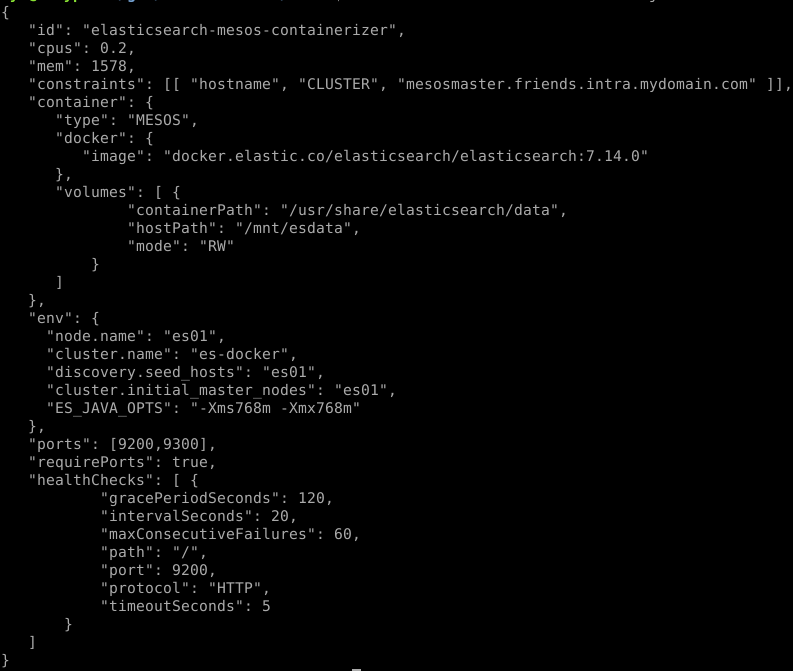
Mesos comes with its own containerizer, able to start applications from OCI images.

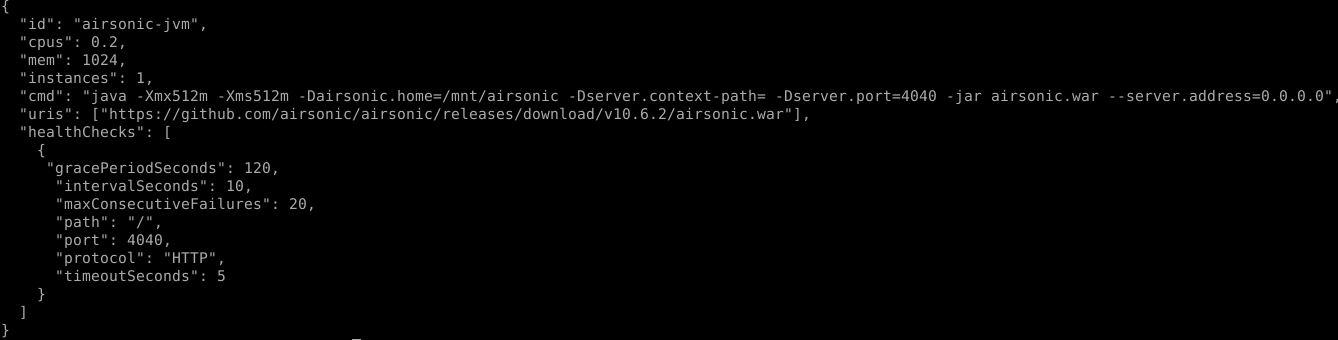
We could also note that Mesos may be used managing services, based on binary or whatever asset we may pull out of an HTTP repository – or already present, on our nodes filesystem. To demonstrate this, we could start some Airsonic application, posting the following to Marathon:

Going further, we should look into other frameworks, such as Chronos – somewhat comparable to Kubernetes Jobs controller.

PID / IPC / network / filesystem / … isolations may be implemented using isolators. Though a lot of features we would usually find in Kubernetes would here be optional.

Nevertheless, deployments are pretty fast considering the few resources I could allocate that lab. With the vast majority of container orchestration solutions being based on the same projects nowadays, it’s nice to see a contestant with its own original take. Even though Mesos probably suffers from limited interest and contributions, when compared with Kubernetes.

Migrating OpenShift 3 Container Runtime

While reaching its end of life, OpenShift 3 remains widely used, and in some cases still more reliable than its successor, OpenShift 4.

OpenShift was historically built on top of Docker, and introduced support for Cri-O, an alternative container runtime. Cri-o integration into OpenShift reached GA with its release 3.9, mid 2018 — based on Kubernetes 1.9 & Cri-o 1.9. Although it has not been without a few hiccups.

As of today, there are still a few bugs involving RPC overflows, when lots of containers are running on a Cri-O nodes, that could result in some operations, addressing all containers, to fail – eg: drains. Or some SDN corruptions, that I suspect to be directly related with Cri-O. Pending RFE to implement SELinux audit logging, similar to what already exists for Docker, … And the fact OpenShift 4 drops Docker support, while ideologically commendable, is quite a bold move right now, considering the youth of Cri-O.


Lately, a customer of mine contacted me regarding a cluster, as I did help them to deploy it. Mid 2019, an architect recommended the with OpenShift 3.11, Cri-O, and GlusterFS CNS storage – aka OCS, OpenShift Container Storage. We did set it up, cluster has been running for almost a year now, when customer opened a case with their support, complaining about an issue with GlusterFS containers behaving unexpectedly.

After a few weeks of troubleshooting, support got back to customer, arguing their setup was not supported, pointing us to a KB item none of us was aware of so far: while OpenShift 3.11 is fully supported with both Cri-O and GlusterFS CNS storage, their combination is not: only Docker, may be used with GlusterFS.

When realizing this, we had to come up with a plan, migrating container runtime from Cri-O to Docker, on any OpenShift node hosting GlusterFS, so support would keep investigating the original issue. Lacking any documentation covering such a migration, I’ve been deploying a lab, reproducing my customer’s cluster.


We will simplify it to an 11 nodes cluster: 3 masters, 3 gluster, 3 ingress, 2 computes. The GlusterFS nodes would also be hosting Prometheus and Hawkular. The Ingress nodes would host the Docker registry and OpenShift routers. We would also deploy a Git server and a few dummy Pods on the compute nodes, hosting some sources and generating activity on GlusterFS backed persistent volumes.

Having reproduced customer’s setup as close as I could, I would then repeat the following process, re-deploying all my GlusterFS nodes. First, let’s pick a node and drain it:

$ oc adm cordon gluster1.demo
$ oc adm drain gluster1.demo --ignore-daemonsets --delete-local-data

Next, we will connect that node, stop OpenShift services, container runtime, dnsmasq, purge some packages, … It will not clean up everything, though would be good enough for us:

# systemctl stop atomic-openshift-node
# systemctl stop crio
# systemctl stop docker
# systemctl disable atomic-openshift-node
# systemctl disable crio
# systemctl disable docker
# grep BOOTSTRAP_CONFIG /etc/sysconfig/atomic-openshift-node
BOOTSTRAP_CONFIG_NAME=node-cm-name
# cp -f /etc/origin/node/resolv.conf /etc/
# systemctl stop dnsmasq
# systemctl disable dnsmasq
# yum -y remove criu docker atomic-openshift-excluder atomic-openshift-docker-excluder cri-tools \
    atomic-openshift-hyperkube atomic-openshift-node docker-client cri-o atomic-openshift-clients \
    dnsmasq
# rm -fr /etc/origin /etc/dnsmasq.d/* /etc/sysconfig/atomic-openshift-node.rpmsave
# reboot

Once node would have rebooted, we may connect back, confirm DNS resolution still works, that container runtimes are gone, … Then we will delete the node from the API:

$ oc delete node gluster1.demo

Next, we would edit our Ansible inventory, reconfiguring that node to only use Docker. In the inventory file, we would add to that node variables some openshift_use_crio=False, overriding some default defined in our group_vars/OSEv3.yaml.

We would also change the openshift_node_group_name variable, to remove the Cri-o specifics from that node kubelet configuration. Note, in some cases, this could involved editing some custom openshift_node_groups definition. For most common deployments, we may only switch the node group name from a crio variant to its docker equivalent (eg: from node-config-infra-crio to node-config-infra).

Finally, still editing Ansible inventory, we would move our migrating node definition, out of the nodes group, and into the new_nodes one — doing so, if you never had to scale that cluster before, be careful that group should inherit your custom OSEv3 settings, maybe set it as children of the OSEv3 host group, though make sure it’s not a member of the node one. At that stage, it is also recommended to have fixed both OpenShift and GlusterFS versions, up to their patch number — in our case, we’re using OCP 3.11.161, OCS 3.11.4.

Make the the node groups configuration is up to date:

$ oc delete -n openshift-node custom-node-group-gfs1 #not necessary if using default node groups
$ ansible-playbook -i inventory /usr/share/ansible/openshift-ansible/playbooks/openshift-master/openshift_node_group.yml

Then, we may proceed as if adding a new node to our cluster:

$ ansible-playbook -i inventory /usr/share/ansible/openshift-ansible/playbooks/openshift-node/scaleup.yml

As soon as the node would have joined back our cluster, the GlusterFS container we were missing should start, using the exact same local volumes and configuration, only now it uses Docker.

Once that GlusterFS Pod is marked back healthy, rsh into any GlusterFS container and query for your volumes health:

$ oc rsh -n glusterfs-namespace ds/glusterfs-clustername
sh-4.2# gluster volume list | while read vol; do
gluster volume heal $vol info;
done

Internal healing mechanisms may not fix all issues, be sure your cluster is healthy before migrating another node. Meanwhile, we would edit back Ansible inventory and make sure to move our node, out of the new_nodes group and back into its original location.

Repeat with all node you need to migrate. Eventually, the openshift_use_crio definition could be moved into some host group settings, avoiding multiple definitions in nodes variables.

To further confirm we were not leaving the cluster in some inconsistent state, I’ve later upgraded that lab, to OCP 3.11.200 and OCS 3.11.5, with only one outstanding note: the atomic-openshift-excluder package was missing, on the nodes I did migrate. While it is installed during cluster deployment, it appears this is not the case during cluster scale outs. Could be a bug with openshift-ansible roles or playbooks: in doubt, make sure to install that package manually afterwards.


Overall, everything went great. While undocumented, this process is nothing extraordinary.

As of migrating to Docker-backed GlusterFS containers, I did reproduce that issue customer was complaining about. As well as another one, related to GlusterFS arbiter bricks space exhaustion.

Thank science, OCS4 is now based on Rook, and Ceph.

KubeVirt

Today we’ll take a quick look at KubeVirt, A Kubernetes native virtualization solution.

While OpenShift and Kubernetes have been all about containers, as of 2018, we’ve started hearing about some weird idea: shipping virtual machines into containers.

Today, KubeVirt is fairly well integrated into OpenShift, which has its own Operator.

If like me, you’re running OpenShift on KVM guests, you’ll first have to make sure nested virtualization was enabled. With an Intel processor, we would look for the following:

$ cat /sys/module/kvm_intel/parameters/nested
Y

Or using AMD:

$ cat /sys/module/kvm_amd/parameters/nested
Y

Unless the above returns with `Y` or `1`, we need to enable nested
virtualization. First, shut down all guests. Then, reload your KVM module:

# modprobe -r kvm_intel
# modprobe kvm_intel nested=1
# cat /sys/module/kvm_intel/parameters/nested
# cat </etc/modprobe.d/kvm.conf
options kvm_intel nested=1
EOF

With AMD, use instead:

# modprobe -r kvm_amd
# modprobe kvm_amd nested=1
# cat /sys/module/kvm_amd/parameters/nested
# cat </etc/modprobe.d/kvm.conf
options kvm_amd nested=1
EOF

Reboot your guests, and confirm you can now find a `/dev/kvm` device:

$ ssh core@compute1.friends
Red Hat Enterprise Linux CoreOS 42.81.20191113.0
...
$ grep vmx /proc/cpuinfo
flags : xxx
...
$ ls /dev/kvm
/dev/kvm

Confirm OpenShift node-capability-detector did discover those devices:

$ oc describe node compute1.xxx
...
Allocatable:
cpu: 7500m
devices.kubevirt.io/kvm: 110
devices.kubevirt.io/tun: 110
devices.kubevirt.io/vhost-net: 110

Now, from the OperatorHub console, we would install the KubeVirt operator. While writing these lines, there are still some bugs, prefer using some lab cluster doing so.

Next, we’ll migrate a test KVM instance, from a regular hypervisor to OpenShift. Here, the first thing we would want to do is to provision a DataVolume.

DataVolumes are built on top of PersistentVolumeClaims, they’re meant to help dealing with persistent volumes, implementing data provisioning.

There’s two ways to go about this: either we can host our disks using a web server, and then we may use the following DataVolume definition:

apiVersion: cdi.kubevirt.io/v1alpha1
kind: DataVolume
metadata:
  name: bluemind-demo
  namespace: wsweet-demo
spec:
  source:
    http:
      url: https://repository.undomaine.com/modeles/kvm/kvm-kubevirt/bm40.qcow2
  pvc:
    accessModes:
    - ReadWriteOnce
    resources:
      requests:
      storage: 20Gi

Or we could use the virtctl client uploading an image from our system into OpenShift:

$ virtctl image-upload dv bluemind-demo --wait-secs=600 --size=8Gi --insecure --block-volume --image-path=/var/lib/libvirt/images/bm40-template.raw
DataVolume wsweet-demo/bluemind-demo created
Waiting for PVC bluemind-demo upload pod to be ready...
Pod now ready
Uploading data to https://cdi-uploadproxy-openshift-operators.apps.undomaine.com
...

The process of uploading a volume would start some temporary Pod, which would use a pair of PVC: one that would receive the final image, the other serving as a temporary storage while upload is running.

Once our image was uploaded, we would be able to create a VirtualMachine object:

apiVersion: kubevirt.io/v1alpha3
kind: VirtualMachine
metadata:
  name: bluemind-demo
  namespace: wsweet-demo
spec:
  running: false
  template:
    metadata:
      labels:
        name: bluemind-demo
    spec:
      domain:
        devices:
          disks:
          - disk:
            bus: virtio
          name: rootfs
          interfaces:
          - name: default
            masquerade: {}
          resources:
            requests:
              memory: 8Gi
              cpu: "1"
      networks:
      - name: default
        pod: {}
terminationGracePeriodSeconds: 600
      volumes:
      - dataVolume:
          name: bluemind-demo
        name: rootfs

$ oc get vm
...
bluemind-demo 2s false
$ virtctl start bluemind-demo
$ oc describe vm bluemind-demo
...
$ oc get vmi
...
bluemind-demo 3s Scheduling
$ oc get pods
...
virt-launcher-bluemind-demo-8kcxz 0/1 ContainerCreating 0 38s

Once that Pod is running, we should be able to attach our guest VNC console:

$ virtctl vnc bluemind-demo

Finish up configuring your system, you may have to rename your network
interfaces, reset IP addresses, fix DNS resolution integrating with OpenShift. Here, we could use cloud-init, or script our own contextualization, installing OpenShift Service CA, …

Docker Images Vulnerability Scan

While several solutions exist scanning Docker images, I’ve been looking for one that I could deploy and use on OpenShift, integrated into my existing CI chain.

The most obvious answer, working with opensource, would be OpenSCAP. Although I’m still largely working with Debian, while OpenSCAP would only check for CentOS databases.

Another popular contender on the market is Twistlock, but I’m not interested in solutions I can’t deploy myself without requesting for “a demo” or talking to people in general.

Eventually, I ended up deploying Clair, an open source product offered by CoreOS, providing with an API.
It queries popular vulnerabilities databases populating its own SQL database, and can then analyze Docker image layers posted to its API.

We could deploy Clair to OpenShift, alongside its Postgres database, using that Template.

The main issue I’ve had with Clair, so far, was that the client, clairctl, relies on Docker socket access, which is not something you would grant any deployment in OpenShift.
And since I wanted to scan my images as part of Jenkins pipelines, I would have my Jenkins master creating scan agents. Allowing Jenkins creating containers with host filesystem access is, in itself, a security issue, as any user that could create a Job scheduling agents with full access to my OpenShift nodes.

Introducing Klar. A project I found on GitHub, go-based, that can scan images against a Clair service, without any special privileges, besides pulling the Docker image out of your registry, and posting layers to Clair.

We would build a Jenkins agent re-using OpenShift base image, shipping with Klar.

Having build our Jenkins agent image, we can write another BuildConfig, defining a Parameterized Pipeline.

Jenkins CoreOS Clair Scan

Jenkins CoreOS Clair Scan

Packages Build Pipeline with OpenShift

As an other follow-up to my previous OpenShift posts, today we would look into Jenkins and Nexus integration with OpenShift, while building a dummy package shipping SSH Keys, both as a debien archive and RPM package.

If you’re not concerned with automating Nexus configuration, then you may use sonatype/nexus3 from the Docker hub setting up Nexus Repository Manager on OpenShift.
As I wanted to automate a few configuration tasks, I eventually started working on my own image, forking from a repository offered by Accenture. My copy isn’t yet released publicly, so I’ld just point out it creates a couple users uploading and downloading Artifacts.

Another subject to address would be to prepare a couple images building our Debian and RPM packages. Regarding RPMs, we could divert from Jenkins base slave image:

FROM openshift/jenkins-slave-base-centos7

RUN yum -y install epel-release \
    && yum -y install @development-tools centos-packager rpmdevtools \
    && yum -y install make wget git curl

USER 1001

While for Debian we would want to build some Stretch-based equivalent:

FROM debian:stretch

ENV HOME=/home/jenkins \
    DEBIAN_FRONTEND=noninteractive

USER root

ADD config/* /usr/local/bin/

RUN apt-get -y update \
    && apt-get -y install bc gettext git subversion openjdk-8-jre-headless gnupg curl wget \
                lsof rsync tar unzip debianutils zip bzip2 make gcc g++ devscripts debhelper \
    && apt-get clean \
    && rm -rf /var/lib/apt/lists/* \
    && mkdir -p /home/jenkins \
    && chown -R 1001:0 /home/jenkins \
    && chmod -R g+w /home/jenkins \
    && chmod 664 /etc/passwd \
    && chmod -R 775 /etc/alternatives /usr/lib/jvm \
    && chmod 775 /usr/bin /usr/share/man/man1

USER 1001

ENTRYPOINT [“/usr/local/bin/run-jnlp-client”]

From there, the last item we’ll need, building our packages, is their sources.

Building RPMs, we would write a Spec file such as the following:

Summary: My Package
Name: my-package
Version: 0.0.1
Release: 1%{?dist}
License: MIT
Source: https://repo/sources/el-%{name}-%{version}.tar.gz
URL: https://my.example.com

Autoreq: no
BuildRequires: git
BuildRequires: make

%description
Does something awesome

%global __os_install_post %{nil}
%define debug_package %{nil}
%prep
%autosetup
%build
%install
make install PREFIX=%{buildroot}

%pre
%prerun
%post
%files
%defattr(-,root,root)
%dir %{_datadir}/mydir
%{_datadir}/mydir/myfile

%changelog
 * Thu Aug 30 2018 It’s Me <mario@example.com> 0.0.1-1
 – Initial release – In an other castle?

Now regarding Debian packages, we would need to create a couple subdirectories, configuration files and scripts:

$ mkdir -p debian/source
$ echo “3.0 (quit)” >debian/source/format
$ echo 9 >debian/compat
$ for i in postinst preinst prerm pstrm; do
cat <<EOF >debian/$i
#!/bin/sh
# $i script for my-package

set -e

case “$1” in
  purge|remove|abort-install|disappear) ;;

  upgrade|failed-upgrade|abort-upgrade) ;;

  *)
    echo “postrm called with unknown argument \`$1′” >&2
    exit 1
    ;;
esac

#DEBHELPER#

exit 0
EOF
chmod +x debian/$i
done
$ for i in docs copyright missing-sources README.Debian; do
touch $i
done
$ cat <<EOF >debian/rules
#!/usr/bin/make -f
#DH_VERBOSE = 1

DPKG_EXPORT_BUILDFLAGS = 1
include /usr/share/dpkg/default.mk

# see FEATURE AREAS in dpkg-buildflags(1)
export DEB_BUILD_MAINT_OPTIONS = hardening=+all

# main packaging script based on dh7 syntax
%:
        dh $@

override_dh_auto_install:
        $(MAKE) install PREFIX=$(CURDIR)/debian/my-package

override_dh_auto_build:
        echo nothing to do

override_dh_auto_test:
        echo nothing to do
EOF
$ chmod +x debian/rules
$ cat <<EOF >debian/changelog
my-package (0.0.1-1) unstable; urgency=low

  * Initial release – In an other castle?

— It’s Me <mario@example.com> Thu, 30 Aug 2018 11:30:42 +0200
EOF

From there, we ensure our sources ships with a Makefile, providing with the following rules:

SHARE_DIR = $(PREFIX)/usr/share

createdebsource:
    LANG=C debuild -S -sa

createdebbin:
    LANG=C dpkg-buildpackage -us -uc

createrpm:
    versionNumber=`awk ‘/^Version:/{print $$2;exit;}’ el/my-package.spec`; \
    wdir=”`pwd`/..”; \
    buildroot=”$$wdir/rpmbuild”; \
    for d in SOURCES SPECS BUILD RPMS SRPMS; \
    do \
      mkdir -p “$$buildroot/$$d”; \
    done; \
    cp -p “$$wdir/el-my-package-$$versionNumber.tar.gz” “$$buildroot/SOURCES/”; \
    cp -p “$$wdir/my-package/el/my-package.spec” “$$buildroot/SPECS/”; \
    if ! whoami >/dev/null 2>&1; then \
      chown -R root:root “$$buildroot/SOURCES” “$$buildroot/SPECS”; \
    elif whoami 2>/dev/null | grep default >/dev/null; then \
      chown -R :root “$$buildroot/SOURCES” “$$buildroot/SPECS”; \
    fi; \
    ( \
      cd “$$buildroot”; \
      LANG=C rpmbuild –define “_topdir $$buildroot” -ba SPECS/my-package.spec && \
      find *RPMS -type f | while read output; \
        do \
          mv “$$output” $$wdir/; \
        done; \
    )

createinitialarchive:
    rm -fr .git .gitignore README.md
    versionNumber=`cat debian/changelog | awk ‘/my-package/{print $$2;exit}’ | sed -e ‘s|[()]||g’ -e ‘s|\\(.*\\)-[0-9]*\$$|\\1|’`; \
    ( \
      cd ..; \
      tar -czf my-package_$$versionNumber.orig.tar.gz my-package; \
      mv my-package my-package-$$versionNumber; \
      tar -czf el-my-package-$$versionNumber.tar.gz my-package-$$versionNumber; \
      mv my-package-$$versionNumber my-package; \
    )

install:
    mkdir -p $(SHARE_DIR)/mydir
    install -c -m 0644 myfile $(SHARE_DIR)/mydir/myfile

At which point, we may use the following OpenShift Template, creating a few secrets and a pair of Jenkins Pipelines, building Debian and RPM packages based on our previous images, then uploading their Artifacts to Nexus :

apiVersion: v1
kind: Template
metadata:
  name: my-package-template
objects:
– apiVersion: v1
  kind: Secret
  metadata:
    annotations:
      jenkins.io/credentials-description : ${APPLICATION_NAME} Git Token credential from Kubernetes
    labels:
      jenkins.io/credentials-type: secretText
    name: git-${APPLICATION_NAME}
  stringData:
    text: ${GIT_DEPLOYMENT_TOKEN}
– apiVersion: v1
  kind: Secret
  metadata:
    annotations:
      jenkins.io/credentials-description : ${APPLICATION_NAME} Nexus Credentials from Kubernetes
    labels:
      jenkins.io/credentials-type: usernamePassword
    name: nexus-${APPLICATION_NAME}
  stringData:
  password: ${NEXUS_ARTIFACTS_PASSWORD}
  username: ${NEXUS_ARTIFACTS_USERNAME}
– apiVersion: v1
  kind: BuildConfig
  metadata:
    annotations:
      description: Builds ${APPLICATION_NAME} rpm archive
    name: ${APPLICATION_NAME}-rpm
  spec:
    strategy:
      jenkinsPipelineStrategy:
        jenkinsfile: |-
          try {
            def pkgname = “${APPLICATION_NAME}”
            def label = “${pkgname}-${UUID.randomUUID().toString()}”
            podTemplate(label: label, name: label, cloud: ‘openshift’,
                containers: [ containerTemplate(name: ‘jnlp’, image: ‘${DOCKER_REGISTRY}/${CENTOS_IMAGE}’) ],
                inheritFrom: ‘nodejs’, serviceAccount: ‘jenkins’) {
              timeout(time: 40, unit: ‘MINUTES’) {
                node (label) {
                  stage(“Fetch”) {
                    sh “git config –global http.sslVerify false”
                    sh “mkdir ${pkgname}”
                    withCredentials([string(credentialsId: “git-${pkgname}”, variable: ‘GIT_TOKEN’)]) {
                      sh “echo ‘${SOURCE_REPOSITORY_URL}’ | sed ‘s|^\\(http[s]*://\\)\\(.*\\)|\\1${GIT_TOKEN}@\\2|’ >cloneFrom 2>/dev/null”
                    }
                    def cloneAddress = readFile(‘cloneFrom’).trim()
                    dir (“${pkgname}”) {
                      git([ branch: “master”, changelog: false, poll: false, url: cloneAddress ])
                    }
                  }
                  stage(“Build”) {
                    sh “””
                    ( cd ${pkgname} ; git rev-parse –short HEAD ) >gitHash
                    ( cd ${pkgname} ; make createinitialarchive ; make createrpm )
                    awk ‘/^Release:/{print \$2;exit;}’ ${pkgname}/el/${pkgname}.spec | cut -d% -f1 >patchNumber
                    awk ‘/^Version:/{print \$2;exit;}’ ${pkgname}/el/${pkgname}.spec >versionNumber
                    “””
                  }
                  stage(“Upload”) {
                    def gitHash = readFile(‘gitHash’).trim()
                    def patch = readFile(‘patchNumber’).trim()
                    def version = readFile(‘versionNumber’).trim()
                    sh “echo Uploading artifacts for ${version}-${patch}-${gitHash}”
                    nexusArtifactUploader(
                      nexusVersion: ‘${NEXUS_VERSION}’,
                      protocol: “${NEXUS_PROTO}”,
                      nexusUrl: “${NEXUS_REMOTE}”,
                      groupId: “${NEXUS_GROUP_ID}”,
                      version: “${version}-${patch}-${gitHash}”,
                      repository: “${NEXUS_RPM_REPOSITORY}”,
                      credentialsId: “nexus-${pkgname}”,
                      artifacts: [
                      [ artifactId: “${pkgname}-rpm”,
                      classifier: ”, type: ‘rpm’,
                      file: “${pkgname}-${version}-${patch}.el7.src.rpm” ],
                      [ artifactId: “${pkgname}-rpm”,
                      classifier: ”, type: ‘rpm’,
                      file: “${pkgname}-${version}-${patch}.el7.x86_64.rpm” ],
                      [ artifactId: “${pkgname}-rpm”,
                      classifier: ”, type: ‘tar.gz’,
                      file: “el-${pkgname}-${version}.tar.gz” ]
                      ]
                    )
                  }
                }
              }
            }
          } catch (err) {
            echo “in catch block”
            echo “Caught: ${err}”
            currentBuild.result = ‘FAILURE’
            throw err
          }
      type: JenkinsPipeline
– apiVersion: v1
  kind: BuildConfig
  metadata:
    annotations:
      description: Builds ${APPLICATION_NAME} deb archive
    name: ${APPLICATION_NAME}-deb
  spec:
    strategy:
      jenkinsPipelineStrategy:
        jenkinsfile: |-
          try {
            def pkgname = “${APPLICATION_NAME}”
            def label = “${pkgname}-${UUID.randomUUID().toString()}”
            podTemplate(label: label, name: label, cloud: ‘openshift’,
                containers: [ containerTemplate(name: ‘jnlp’, image: ‘${DOCKER_REGISTRY}/${DEBIAN_IMAGE}’) ],
                inheritFrom: ‘nodejs’, serviceAccount: ‘jenkins’) {
              timeout(time: 40, unit: ‘MINUTES’) {
                node (label) {
                  stage(“Fetch”) {
                    sh “git config –global http.sslVerify false”
                    sh “mkdir ${pkgname}”
                    withCredentials([string(credentialsId: “git-${pkgname}”, variable: ‘GIT_TOKEN’)]) {
                      sh “echo ‘${SOURCE_REPOSITORY_URL}’ | sed ‘s|^\\(http[s]*://\\)\\(.*\\)|\\1${GIT_TOKEN}@\\2|’ >cloneFrom 2>/dev/null”
                    }
                    def cloneAddress = readFile(‘cloneFrom’).trim()
                    dir (“${pkgname}”) {
                      git([ branch: “master”, changelog: false, poll: false, url: cloneAddress ])
                    }
                  }
                  stage(“Build”) {
                    sh “””
                    ( cd ${pkgname} ; git rev-parse –short HEAD ) >gitHash
                    ( cd ${pkgname} ; make createinitialarchive ; make createdebbin )
                    cat ${pkgname}/debian/changelog | awk ‘/${pkgname}/{print \$2;exit}’ | sed -e ‘s|[()]||g’ -e ‘s|.*-\\([0-9]*\\)\$|\\1|’ >patchNumber
                    cat ${pkgname}/debian/changelog | awk ‘/${pkgname}/{print \$2;exit}’ | sed -e ‘s|[()]||g’ -e ‘s|\\(.*\\)-[0-9]*\$|\\1|’ >versionNumber
                    “””
                  }
                  stage(“Upload”) {
                    def gitHash = readFile(‘gitHash’).trim()
                    def patch = readFile(‘patchNumber’).trim()
                    def version = readFile(‘versionNumber’).trim()
                    sh “echo Uploading artifacts for ${version}-${patch}-${gitHash}”
                    nexusArtifactUploader(
                      nexusVersion: ‘${NEXUS_VERSION}’,
                      protocol: “${NEXUS_PROTO}”,
                      nexusUrl: “${NEXUS_REMOTE}”,
                      groupId: “${NEXUS_GROUP_ID}”,
                      version: “${version}-${patch}-${gitHash}”,
                      repository: “${NEXUS_DEB_REPOSITORY}”,
                      credentialsId: “nexus-${pkgname}”,
                      artifacts: [
                      [ artifactId: “${pkgname}-deb”,
                      classifier: ”, type: ‘deb’,
                      file: “${pkgname}_${version}-${patch}_all.deb” ],
                      [ artifactId: “${pkgname}-deb”,
                      classifier: ”, type: ‘txt’,
                      file: “${pkgname}_${version}-${patch}_amd64.buildinfo” ],
                      [ artifactId: “${pkgname}-deb”,
                      classifier: ”, type: ‘txt’,
                      file: “${pkgname}_${version}-${patch}_amd64.changes” ],
                      [ artifactId: “${pkgname}-deb”,
                      classifier: ”, type: ‘tar.xz’,
                      file: “${pkgname}_${version}-${patch}.debian.tar.xz” ],
                      [ artifactId: “${pkgname}-dev”,
                      classifier: ”, type: ‘tar.gz’,
                      file: “${pkgname}_${version}.orig.tar.gz” ],
                      [ artifactId: “${pkgname}-deb”,
                      classifier: ”, type: ‘txt’,
                      file: “${pkgname}_${version}-${patch}.dsc” ]
                      ]
                    )
                  }
                }
              }
            }
          } catch (err) {
            echo “in catch block”
            echo “Caught: ${err}”
            currentBuild.result = ‘FAILURE’
            throw err
          }
      type: JenkinsPipeline
parameters:
– name: APPLICATION_NAME
  description: Package Name – should match that expected by package we’ll build
  displayName: Package Name
  value: my-package
– name: DEBIAN_IMAGE
  description: Jenkins Debian Agent Image – relative to DOCKER_REGISTRY
  displayName: Jenkins Debian Agent Image
  required: true
  value: “cicd/jenkins-agent-debian:latest”
– name: DOCKER_REGISTRY
  description: Docker Registry
  displayName: Docker Registry
  required: true
  value: docker-registry.default.svc:5000
– name: CENTOS_IMAGE
  description: Jenkins Centos Agent Image – relative to DOCKER_REGISTRY
  displayName: Jenkins Centos Agent Image
  required: true
  value: “cicd/jenkins-agent-centos:latest”
– name: GIT_DEPLOYMENT_TOKEN
  description: Git deployment token
  displayName: Git Deployment Token
  required: true
– name: NEXUS_ARTIFACTS_PASSWORD
  description: Nexus Artifacts Upload Password
  displayName: Nexus Artifacts Upload Password
  required: true
  value: admin123
– name: NEXUS_ARTIFACTS_USERNAME
  description: Nexus Artifacts Upload Username
  displayName: Nexus Artifacts Upload Username
  required: true
  value: admin
– name: NEXUS_GROUP_ID
  description: Nexus Group ID
  displayName: Nexus Group ID
  required: true
  value: com.example
– name: NEXUS_DEB_REPOSITORY
  description: Nexus Artifact Debian Repository – remote repository name
  displayName: Nexus Artifact Debian Repository
  required: true
  value: debian
– name: NEXUS_PROTO
  description: Nexus Proto – http or https
  displayName: Nexus Proto
  required: true
  value: http
– name: NEXUS_REMOTE
  description: Nexus Remote URL – proto-less URI connecting to Nexus
  displayName: Nexus Remote URL
  value: “nexus:8081”
  required: true
– name: NEXUS_RPM_REPOSITORY
  description: Nexus Artifact EL Repository – remote repository name
  displayName: Nexus Artifact EL Repository
  required: true
  value: centos
– name: NEXUS_VERSION
  description: Nexus Repository Version
  displayName: Nexus Repository Version
  required: true
  value: nexus3
– name: SOURCE_REPOSITORY_URL
  description: The URL of the repository with your application source code
  displayName: Git Repository URL
  required: true
  value: https://git.example.com/project/my-package

Signing and Scanning Docker Images with OpenShift

You may already know Docker images can be signed. Today we would discuss a way to automate images signature, using OpenShift.

Lately, I stumbled upon a bunch of interesting repositories:

  • https://github.com/redhat-cop/openshift-image-signing-scanning: ansible playbook configuring an OCP cluster, building a base image, setting up a service account and installing a few templates providing with docker images scanning and signing
  • https://github.com/redhat-cop/image-scanning-signing-service: an optional OpenShift third-party service implementing support for ImageSigningRequest and ImageScanningRequest objects
  • https://github.com/redhat-cop/openshift-event-controller: sources building an event controller that would watch for new images pushed to OpenShift docker registry
  • Although these are amazing, I could not deploy them to my OpenShift Origin, due to missing subscriptions and packages.

    image signing environment overview

    image signing environment overview

    In an effort to introduce CentOS support, I forked the first repository from our previous list, and started rewriting what I needed:

    https://github.com/faust64/openshift-image-signing-scanning


    A typical deployment would involve:

  • Generating a GPG keypair on some server (not necessarily related to OpenShift)
  • Depending on your usecase, we could then want to configure docker to prevent unsigned images from being run on our main OpenShift hosts
  • Next, we would setup labels and taints identifying the nodes we trust signing images, as well as apply and install a few templates and a base image
  • At which point, you could either install the event-controller Deployment to watch for all your OpenShift internal registry’s images.

    Or, you could integrate images scanning and signature yourself using the few templates installed, as shown in a sample Jenkinsfile.

    OpenShift

    As of late 2017, I got introduced to OpenShift. Even though I’ve only been playing with a few basic features, nesting Docker into static KVMs,  I was pretty impressed by the simplicity of services deployment, as served to end-users.

    After replacing 4x MicroServer, by 3x SE318m1

    After replacing 4x MicroServer, by 3x SE318m1

    I’ve first tried setting my own, re-using my ProLian MicroServers. One of my master node was refusing to deploy, CPU usage averaging around 100%, systemctl consistently timing out while starting some process – that did start on my two other master nodes.
    After trying to resize my KVMs in vain, I eventually went another way: shut down a stair of ProLian MicroServer, move them out of my rack and plug instead 3 servers I ordered a couple years ago, that never reached prod – due to doubts regarding overall power consumption, EDF being able to deliver enough Amperes, my switches not being able to provide with enough LACP channels, my not having enough SSDs or quad-port Ethernet cards in stock to fill these servers,  …

    I eventually compromised, and harvested any 500G SSDs disks available out of my Ceph cluster, mounting one per 1U server.

    Final setup involves the following physical servers:

    • a custom tower (core i5, 32G DDR, 128G SSD disk)
    • 3x HP SE316M1 (2xE5520, 24G DDR) – 500G SSD
    • 2x HP SE1102 (2xE5420 12G DDR) – 500G SSD
    • 3x ProLian MicroServer G5 (Turion, 4-8G DDR) – 64G SSD + 3×3-4T HDD

    And on top of these, a set of KVM instances, including:

    • 3 master nodes (2 CPU, 8G RAM)
    • 3 infra nodes (2 CPU, 6G RAM)
    • 3 compute nodes (4 CPU, 10G RAM @SE316M1)
    • 3 storage nodes (1 CPU, 3G RAM @MicroServer)

    Everything running on CentOS7. Except for some Ansible DomU I would use deploying OpenShift, running Debian Stretch.


    OpenShift can be deployed using Ansible. And as I’ve been writing my own roles for the past couple years, I can testify these ones are amazing.

    GlusterFS @OpenShift

    GlusterFS @OpenShift

    First ansible run would be done setting the following variables, bootstrapping service on top of my existing domain name, and LDAP server.

    ansible_ssh_user: root
    openshift_deployment_type: origin
    openshift_disable_check: disk_availability,docker_storage,memory_availability
    openshift_master_cluster_method: native
    openshift_master_cluster_hostname: openshift.intra.unetresgrossebite.com
    openshift_master_cluster_public_hostname: openshift.intra.unetresgrossebite.com
    openshift_master_default_subdomain: router.intra.unetresgrossebite.com
    openshift.common.dns_domain: openshift.intra.unetresgrossebite.com
    openshift_clock_enabled: True
    openshift_node_kubelet_args: {‘pods-per-core’: [’10’], ‘max-pods’: [‘250’], ‘image-gc-high-threshold’: [’90’], ‘image-gc-low-threshold’: [’80’]}
    openshift_master_identity_providers:
    – name: UneTresGrosseBite
      challenge: ‘true’
      login: ‘true’
      kind: LDAPPasswordIdentityProvider
      attributes:
        id: [‘dn’]
        email: [‘mail’]
        name: [‘sn’]
        preferredUsername: [‘uid’]
      bindDN: cn=openshift,ou=services,dc=unetresgrossebite,dc=com
      bindPassword: secret
      ca: ldap-chain.crt
      insecure: ‘false’
      url: ‘ldaps://netserv.vms.intra.unetresgrossebite.com/ou=users,dc=unetresgrossebite,dc=com?uid?sub?(&(objectClass=inetOrgPerson)(!(pwdAccountLockedTime=*)))’
    openshift_master_ldap_ca_file: /root/ldap-chain.crt

    Setting up glusterfs, note you may have difficulties setting gluster block devices as group vars, and could find a solution sticking to defining these directly into your inventory file:

    [glusterfs]
    gluster1.friends.intra.unetresgrossebite.com glusterfs_ip=10.42.253.100 glusterfs_devices='[ “/dev/vdb”, “/dev/vdc”, “/dev/vdd” ]’
    gluster2.friends.intra.unetresgrossebite.com glusterfs_ip=10.42.253.101 glusterfs_devices='[ “/dev/vdb”, “/dev/vdc”, “/dev/vdd” ]’
    gluster3.friends.intra.unetresgrossebite.com glusterfs_ip=10.42.253.102 glusterfs_devices='[ “/dev/vdb”, “/dev/vdc”, “/dev/vdd” ]’

    Apply the main playbook with:

    ansible-playbook playbooks/byo/config.yml -i ./hosts

    Have a break: with 4 CPUs & 8G RAM on my ansible host, applying a single variable change (pretty much everything was installed beforehand), I would still need over an hour and a half applying the full playbook: whenever possible, stick to whatever service-specific playbook you may find, …

    Jenkins @OpenShift

    Jenkins @OpenShift

    As a sidenote, be careful to properly set your domain name before deploying glusterfs. So far, while I was able to update my domain name almost everywhere running Ansible playbooks back, GlusterFS’s hekiti route was the first I noticed not being renamed.
    Should you fuck up your setup, you can use oc project glusterfs then oc get pods to locate your running containers, use oc rsh <container> then rm -fr /var/lib/hekiti to purge stuff that may prevent further deployments, …
    Then oc delete project glusterfs, to purge almost everything else.
    You may also use running docker images | grep gluster and docker rmi <images>, … As well as making sure to wipe the first sectors of your gluster disks (for d in b c d; do dd if=/dev/zero of=/dev/vd$d bs=1M count=8; done). You may need to reboot your hosts (if a wipefs -a /dev/drive returns with an error). Finally, re-deploy a new GlusterFS cluster from scratch using Ansible.


    Once done with the main playbook, you should be able to log into your OpenShift dashboard. Test it by deploying Jenkins.

    hawkular @OpenShift

    Hawkular integration @OpenShift


    You could (should) also look into deploying OpenShift cluster metrics collection, based on Hawkular & Heapster.
    Sticking with volatile storage, you would need adding the following variable to all your hosts:


    openshift_metrics_install_metrics: True

    Note to deploy these roles, you would have to install on your Ansible host (manually!) python-passlib, apache2-utils and openjdk-8-jdk-headless (assuming Debian/Ubuntu). You may then deploy metrics using the playbooks/byo/openshift-cluster/openshift-metrics.yml playbook.

    Hawkular integration would allow you to track resources usage directly from OpenShift dashboard.

    Prometheus @OpenShift

    Prometheus @OpenShift

    You could also setup Prometheus defining the following:

    openshift_prometheus_namespace: openshift-metrics
    openshift_prometheus_node_selector: {“region”:”infra”}

    And applying the playbooks/byo/openshift-cluster/openshift-prometheus.yml playbook.


    You should also be able to setup some kind of centralized logging based on ElasticSearch, Kibana & Fluentd, using the following:

    openshift_logging_install_logging: True
    openshift_logging_kibana_hostname: kibana.router.intra.unetresgrossebite.com
    openshift_logging_es_memory_limit: 4Gi
    openshift_logging_storage_kind: dynamic
    openshift_cloudprovider_kind: glusterfs

    Although so far, I wasn’t able to get it running properly ElasticSearch health is stuck to yellow, while Kibana and Fluentd can’t reach it somehow, could be due to a missing DNS record.


    From there, you would find plenty solutions, packaged for OpenShift, ready to deploy (a popular one seems to be Go Git Server).
    Deploying new services can still be a little painful, although there’s no denying OpenShift offers with a potentially amazing SAAS toolbox.

    Graphite & Riemann

    There are several ways of collecting runtime metrics out of your software. We’ve discussed of Munin or Datadog already, we could talk about Collectd as well, although these solutions would mostly aim at system monitoring, as opposed to distributed systems.

    Business Intelligence may require collecting metrics from a cluster of workers, aggregating them into comprehensive graphs, such as short-living instances won’t imply a growing collection of distinct graphs.


    Riemann is a Java web service, allowing to collect metrics over TCP or UDP, and serving with a simple web interface generating dashboards, displaying your metrics as they’re received. Configuring Riemann, you would be able to apply your input with transformations, filtering, … You may find a quickstart here, or something more exhaustive over there. A good starting point could be to keep it simple:

    (logging/init {:file “/var/log/riemann/riemann.log”})
    (let [host “0.0.0.0”]
    (tcp-server {:host host})
    (ws-server {:host host}))
    (periodically-expire 5)
    (let [index (index)] (streams (default :ttl 60 index (expired (fn [event] (info “expired” event))))))

    Riemann Sample Dashboard

    Riemann Sample Dashboard

    Despite being usually suspicious of Java applications or Ruby web services, I tend to trust Riemann even under heavy workload (tens of collectd, forwarding hundreds of metrics per second).

    Riemann Dashboard may look unappealing at first, although you should be able to build your own monitoring screen relatively easily. Then again, this would require a little practice, and some basic sense of aesthetics.


    Graphite Composer

    Graphite Composer

    Graphite is a Python web service providing with a minimalist yet pretty powerful browser-based client, that would allow you to render graphs. Basic Graphite setup would usually involve some SQlite database storing your custom graphs and users, as long as another Python service: Carbon, storing metrics. Such setup would usually also involve Statsd, a NodeJS service listening for metrics, although depending on what you intend to monitor, you might find your way into writing to Carbon directly.

    Setting up Graphite on Debian Stretch may be problematic, due to some python packages being deprecated, while the last Graphite packages aren’t available yet. After unsuccessfully trying to pull copies from PIP instead of APT, I eventually ended up setting my first production instance based on Devuan Jessie. Setup process would drastically vary based on distribution, versions, your web server, Graphite database, … Should you go there: consider all options carefully before starting.

    Graphite could be used as is: the Graphite Composer would let you generate and save graphs, aggregating any collected metric, while the Dashboard view would let you aggregate several graphs into a single page. Although note you could use Graphite as part of Grafana as well, among others.


    From there, note Riemann can be reconfigured forwarding everything to Graphite (or using your own filters), adding to your riemann.config:

    (def graph (graphite {:host “10.71.100.164”}))
    (streams graph)

    This should allow you to run Graphite without Statsd, having Riemann collecting metrics from your software and forwarding them into Carbon.


    The next step would be to configure your applications, forwarding data to Riemann (or Statsd, should you want to only use Graphite). Databases like Cassandra or Riak could forward some of their own internal metrics, using the right agent. Or, collecting BI metrics from your own code.

    Graphite Dashboard

    Graphite Dashboard

    Using NodeJS, you will find a riemannjs module that does the job. Or node-statsd-client, for Statsd.

    Having added some scheduled tasks to our code, querying for how many accounts we have, how many are closed, how many were active during the last day, week and month, … I’m eventually able to create a dashboard based on saved graphs, aggregating metrics in some arguably-meaningful fashion.

    m242/Maildrop

    A couple days ago, some colleague of mine asked me to set up our own Maildrop service, as served by maildrop.cc. Some of you may also be familiar with Mailinator, which offers with a similar service.

    Note to be confused with Maildrop (popular MDA, as distributed in Debian packages, among others, …) m242/Maildrop is based on Scala, Java and a Redis queue. The project is divided into two workers connecting to Redis.

    maildrop

    maildrop

    An SMTP worker would be processing inbound messages, eventually writing them to Redis. Listening on 127.0.0.1:25000 by default, nginx may be used proxying traffic.

    Meanwhile, the HTTP worker would serve clients with any mailbox – no authentication required. Developers may write tests checking for some arbitrary mailbox using some HTTP API.

    As you may guess: both workers and database may be scaled horizontally. Although being a pretty specific implementation, you probably won’t need it to.

    Their GitHub project isn’t much active, sadly. A few issues piling up, two of which I’ve been able to post pull requests for. Then again, getting it working isn’t much complicated, and may prove pretty useful testing for regressions.

    Wazuh

    As a follow-up to our previous OSSEC post, and to complete the one on Fail2ban & ELK, we’ll review today Wazuh.

    netstat alerts

    netstat alerts

    As their documentation states it, “Wazuh is a security detection, visibility, and compliance open source project. It was born as a fork of OSSEC HIDS, later was integrated with Elastic Stack and OpenSCAP evolving into a more comprehensive solution“. We could remark that OSSEC packages used to be distributed on some Wazuh repository, while Wazuh is still listed as OSSEC official training, deployment and assistance services provider. You might still want to clean up some defaults, as you would soon end up receiving notifications for any connection being established or closed …

    OSSEC is still maintained, last commit to their GitHub project was a couple days ago as of writing this post, while other commits are being pushed to Wazuh repository. If both products are still active, my last attempts configuring Kibana integration with OSSEC was a failure, due to Kibana5 not being supported. Considering Wazuh offers enterprise support, we could assume their sample configuration & ruleset are at least as relevant as those you’ld find with OSSEC.

    wazuh manager status

    wazuh manager status

    Wazuh documentation is pretty straight-forward, a new service wazuh-api (NodeJS) would be required on your managers, which would then be used by Kibana querying Wazuh status. Debian packages were renamed from ossec-hids & ossec-hids-agent to wazuh-manager & wazuh-agent respectively. Configuration is somewhat similar, although you won’t be able to re-use those you could have installed alongside OSSEC. Note the wazuh-agent package would install an empty key file: you would need to drop it, prior to registering against your manager.


    wazuh-agents

    wazuh agents

    Configuring Kibana integration, note Wazuh documentation misses some important detail, as reported on GitHub. That’s the single surprise I had reading through their documentation, the rest of their instructions work as expected: having installed and started wazuh-api service on your manager, then installed Kibana wazuh plugin on your all your Kibana instances, you would find some Wazuh menu showing on the left. Make sure your wazuh-alerts index is registered in the Management section, then go to Wazuh.

    If uninitialized, you would be offered to enter your Wazuh backend URL, a port, a username and corresponding password, connecting to wazuh-api. Note that configuration would be saved into some new .wazuh index. Once configured, you would have some live view of your setup, which agents are connected, what alerts you’re receiving, … eventually, set up new dashboards.

    Comparing this to OSSEC PHP web interface, marked as deprecated since years, … Wazuh takes the lead!

    CIS compliance

    CIS compliance

    OSSEC alerts

    OSSEC alerts

    Wazuh Overview

    Wazuh Overview

    PCI Compliance

    PCI Compliance