Wazuh
As a follow-up to our previous OSSEC post, and to complete the one on Fail2ban & ELK, we’ll review today Wazuh.
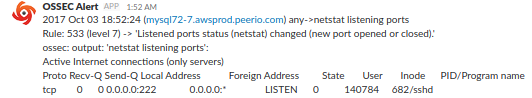
netstat alerts
As their documentation states it, “Wazuh is a security detection, visibility, and compliance open source project. It was born as a fork of OSSEC HIDS, later was integrated with Elastic Stack and OpenSCAP evolving into a more comprehensive solution“. We could remark that OSSEC packages used to be distributed on some Wazuh repository, while Wazuh is still listed as OSSEC official training, deployment and assistance services provider. You might still want to clean up some defaults, as you would soon end up receiving notifications for any connection being established or closed …
OSSEC is still maintained, last commit to their GitHub project was a couple days ago as of writing this post, while other commits are being pushed to Wazuh repository. If both products are still active, my last attempts configuring Kibana integration with OSSEC was a failure, due to Kibana5 not being supported. Considering Wazuh offers enterprise support, we could assume their sample configuration & ruleset are at least as relevant as those you’ld find with OSSEC.

wazuh manager status
Wazuh documentation is pretty straight-forward, a new service wazuh-api (NodeJS) would be required on your managers, which would then be used by Kibana querying Wazuh status. Debian packages were renamed from ossec-hids & ossec-hids-agent to wazuh-manager & wazuh-agent respectively. Configuration is somewhat similar, although you won’t be able to re-use those you could have installed alongside OSSEC. Note the wazuh-agent package would install an empty key file: you would need to drop it, prior to registering against your manager.
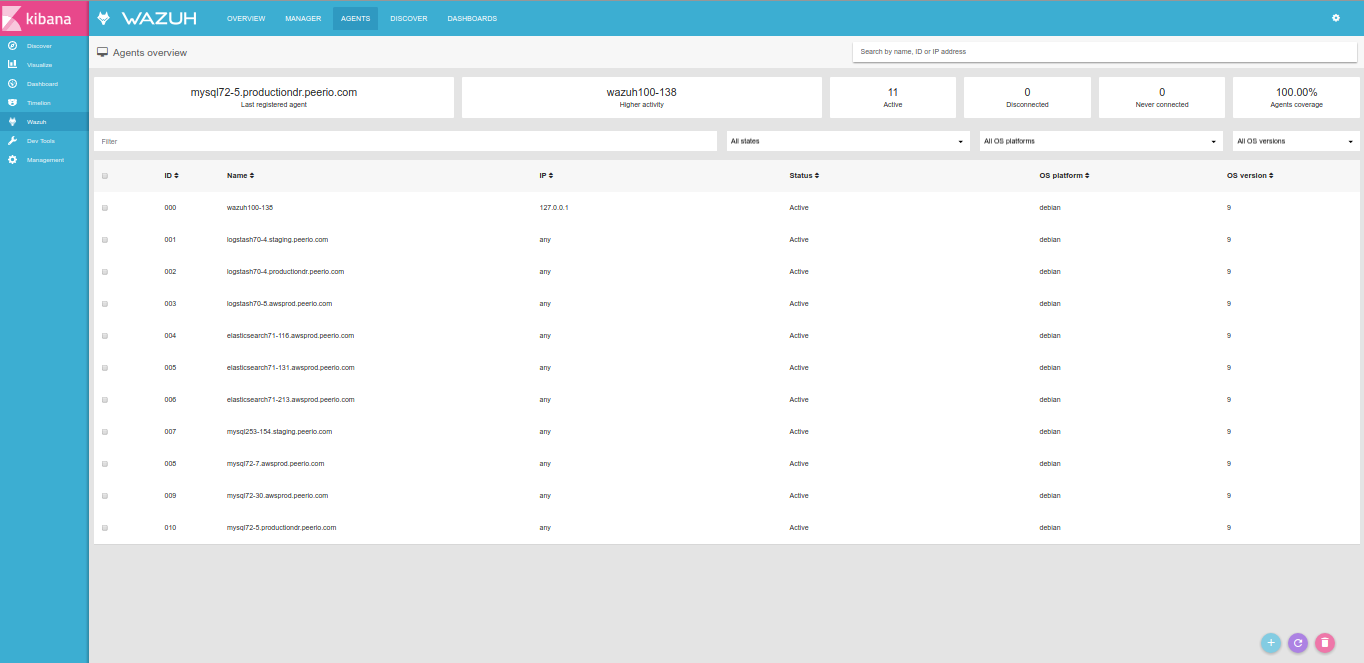
wazuh agents
Configuring Kibana integration, note Wazuh documentation misses some important detail, as reported on GitHub. That’s the single surprise I had reading through their documentation, the rest of their instructions work as expected: having installed and started wazuh-api service on your manager, then installed Kibana wazuh plugin on your all your Kibana instances, you would find some Wazuh menu showing on the left. Make sure your wazuh-alerts index is registered in the Management section, then go to Wazuh.
If uninitialized, you would be offered to enter your Wazuh backend URL, a port, a username and corresponding password, connecting to wazuh-api. Note that configuration would be saved into some new .wazuh index. Once configured, you would have some live view of your setup, which agents are connected, what alerts you’re receiving, … eventually, set up new dashboards.
Comparing this to OSSEC PHP web interface, marked as deprecated since years, … Wazuh takes the lead!
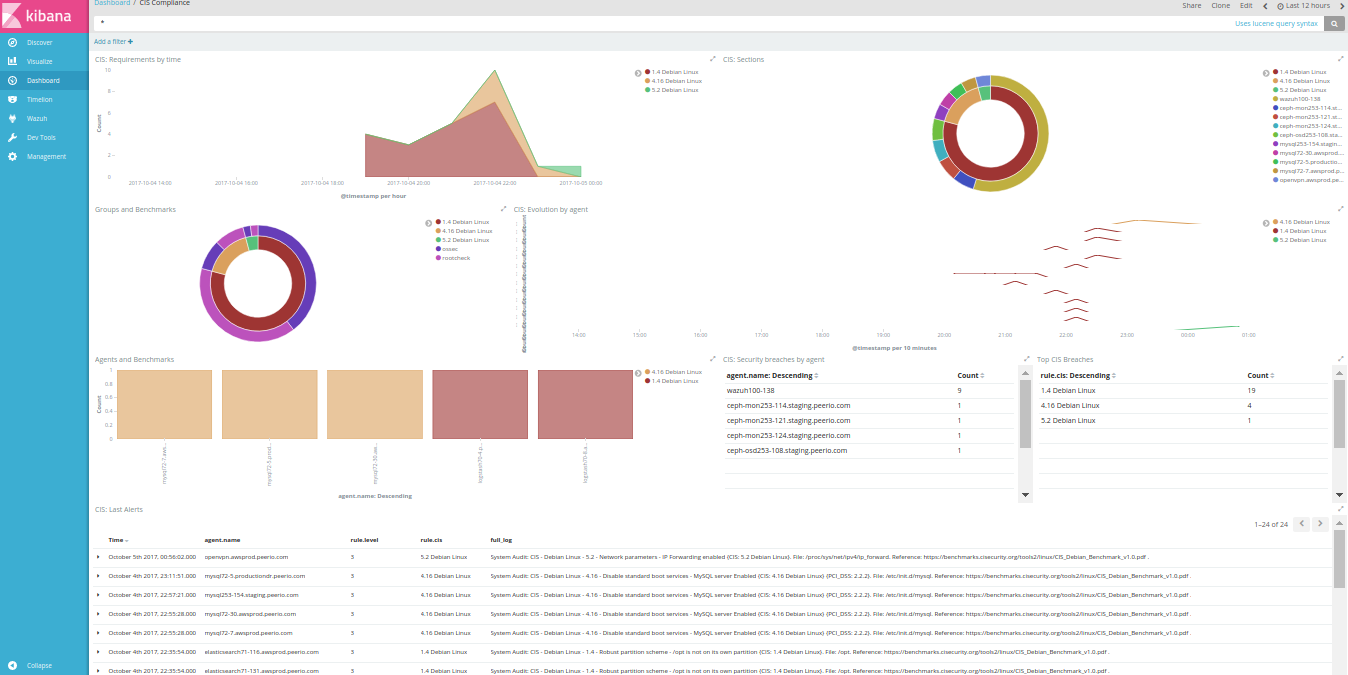
CIS compliance
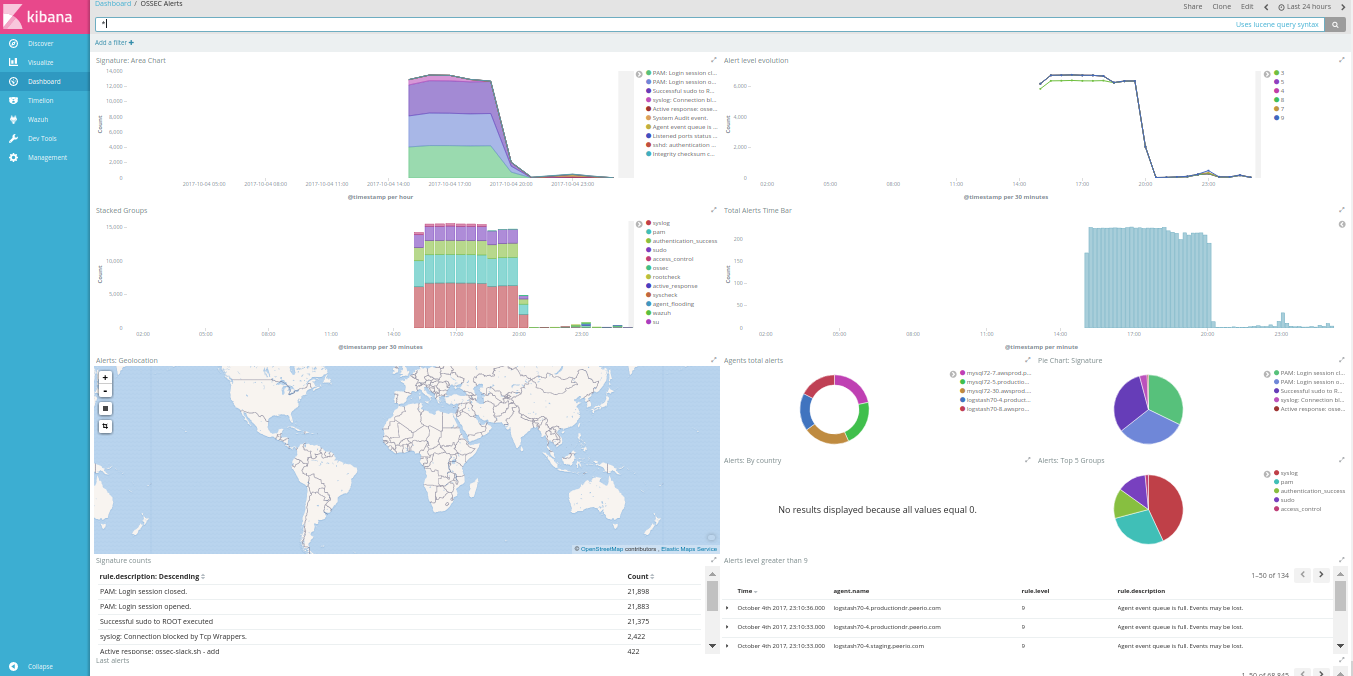
OSSEC alerts
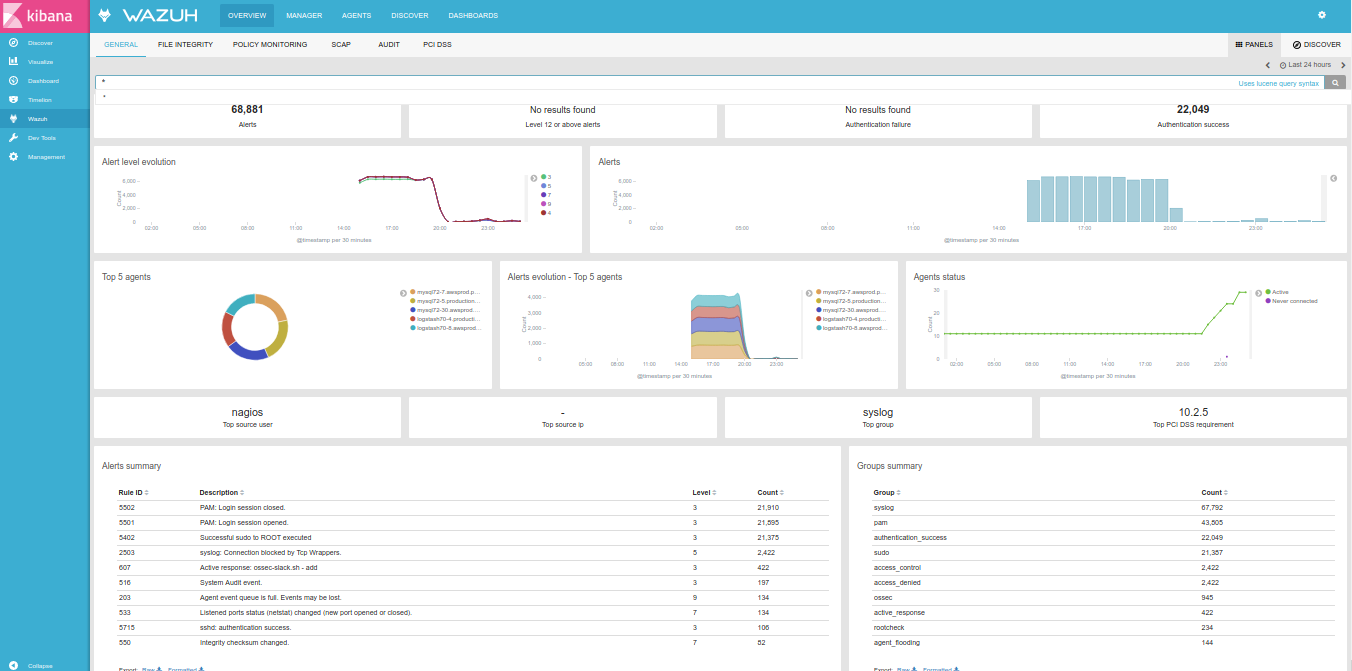
Wazuh Overview
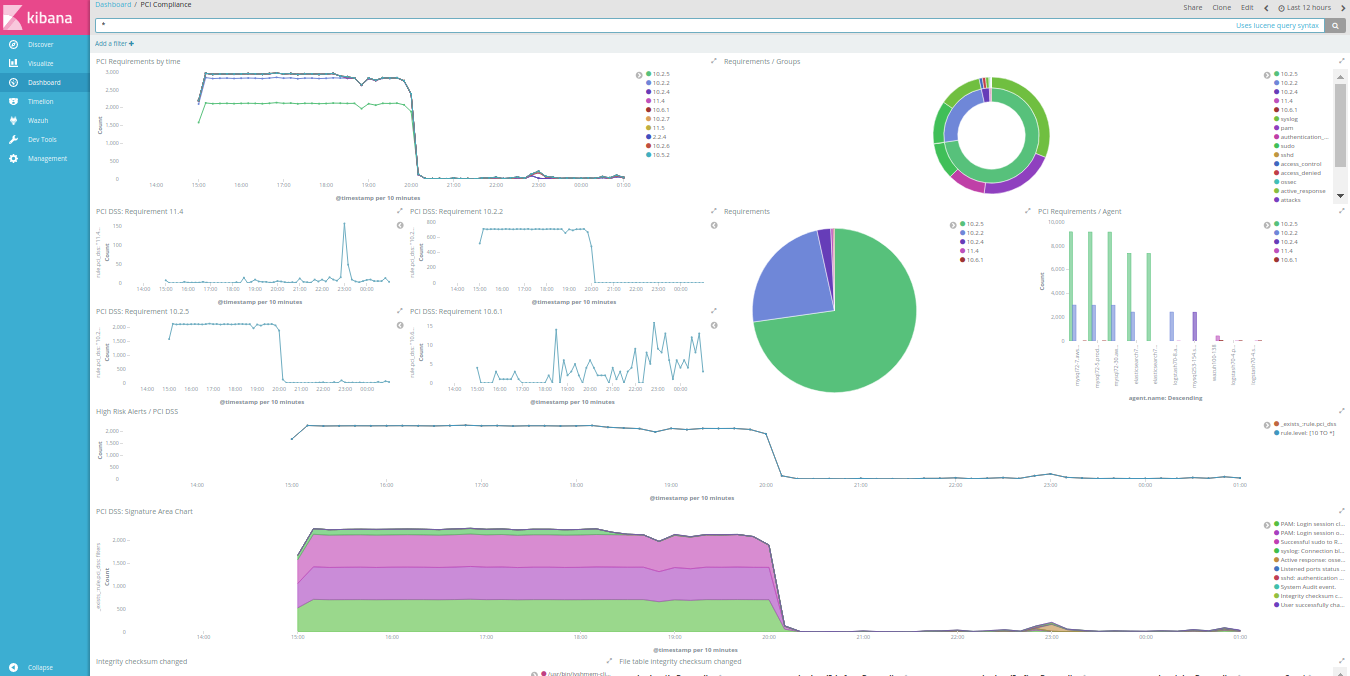
PCI Compliance