Menu

Results for category "Best Practices"

30 Articles

Deploying Kubernetes with KubeSpray

I should first admit OpenShift 4 is slowly recovering from its architectural do-over. I’m still missing something that would be production ready, and quite disappointed by the waste of resources, violent upgrades, broken CSI, somewhat unstable RH-CoreOS, a complicated deployment scheme when dealing with bare-metal, … among lesser critical bugs.

OpenShift 3 is still an interesting platform hosting production workloads, although its being based on Kubernetes 1.11 makes it quite an old version already.

After some experimentation on a Raspberry-Pi lab, I figured I would give Kubernetes a try on x86. Doing so, I would be looking at KubeSpray.


If you’re familiar with OpenShift 3 cluster deployments, you may have been using openshift-ansible already. Kube-spray is a similar solution, focused on Kubernetes, simplifying the process of bootstrapping, scaling and upgrading highly available clusters.

Currently, kube-spray allows for deploying Kubernetes with container runtimes such as docker, cri-o, containerd, SDN based on flannel, weave, calico, … as well as a registry, some nginx based ingress controller, certs manager controller, integrated metrics, or the localvolumes, rbd and cephfs provisioner plugins.

Comparing with OpenShift 4, the main missing components would be the cluster and developer consoles, RBAC integrating with users and groups from some third-party authentication provider. Arguably, the OLM, though I never really liked that one — makes your operators deployment quite abstract, and complicated to troubleshoot, as it involves several namespaces and containers, … The Prometheus Operator, that could still be deployed manually.
I can confirm everything works perfectly deploying on Debian Buster nodes, with containerd and calico. Keeping pretty much all defaults in place and activating all addons.


The sample variables shipping with kube-spray are pretty much on point. We would create an inventory file, such as the following:

all:
  hosts:
    master1:
      access_ip: 10.42.253.10
      ansible_host: 10.42.253.10
      ip: 10.42.253.10
      node_labels:
        infra.utgb/zone: momos-adm
    master2:
      access_ip: 10.42.253.11
      ansible_host: 10.42.253.11
      ip: 10.42.253.11
      node_labels:
        infra.utgb/zone: thaoatmos-adm
    master3:
      access_ip: 10.42.253.12
      ansible_host: 10.42.253.12
      ip: 10.42.253.12
      node_labels:
        infra.utgb/zone: moros-adm
    infra1:
      access_ip: 10.42.253.13
      ansible_host: 10.42.253.13
      ip: 10.42.253.13
      node_labels:
        node-role.kubernetes.io/infra: “true”
        infra.utgb/zone: momos-adm
    infra2:
      access_ip: 10.42.253.14
      ansible_host: 10.42.253.14
      ip: 10.42.253.14
      node_labels:
        node-role.kubernetes.io/infra: “true”
        infra.utgb/zone: thanatos-adm
    infra3:
      access_ip: 10.42.253.15
      ansible_host: 10.42.253.15
      ip: 10.42.253.15
      node_labels:
        node-role.kubernetes.io/infra: “true”
        infra.utgb/zone: moros-adm
    compute1:
      access_ip: 10.42.253.20
      ansible_host: 10.42.253.20
      ip: 10.42.253.20
      node_labels:
        node-role.kubernetes.io/worker: “true”
        infra.utgb/zone: momos-adm
    compute2:
      access_ip: 10.42.253.21
      ansible_host: 10.42.253.21
      ip: 10.42.253.21
      node_labels:
        node-role.kubernetes.io/worker: “true”
        infra.utgb/zone: moros-adm
    compute3:
      access_ip: 10.42.253.22
      ansible_host: 10.42.253.22
      ip: 10.42.253.22
      node_labels:
        node-role.kubernetes.io/worker: “true”
        infra.utgb/zone: momos-adm
    compute4:
      access_ip: 10.42.253.23
      ansible_host: 10.42.253.23
      ip: 10.42.253.23
      node_labels:
        node-role.kubernetes.io/worker: “true”
        infra.utgb/zone: moros-adm
    children:
      kube-master:
        hosts:
          master1:
          master2:
          master3:
      kube-infra:
        hosts:
          infra1:
          infra2:
          infra3:
      kube-worker:
        hosts:
          compute1:
          compute2:
          compute3:
          compute4:
      kube-node:
        children:
          kube-master:
          kube-infra:
          kube-worker:
      etcd:
        hosts:
          master1:
          master2:
          master3:
      k8s-cluster:
        children:
          kube-master:
          kube-node:
      calico-rr:
        hosts: {}

Then, we’ll edit the sample group_vars/etcd.yml:

etcd_compaction_retention: “8”
etcd_metrics: basic
etcd_memory_limit: 5GB
etcd_quota_backend_bytes: 2147483648
# ^ WARNING: sample var tells about “2G”
# which results in etcd not starting (deployment_type=host)
# journalctl shows errors such as:
# > invalid value “2G” for ETCD_QUOTA_BACKEND_BYTES: strconv.ParseInt: parsing “2G”: invalid syntax
# Also note: here, I’m setting 20G, not 2.
etcd_deployment_type: host

Next, common variables in group_vars/all/all.yml:

etcd_data_dir: /var/lib/etcd
bin_dir: /usr/local/bin
kubelet_load_modules: true
upstream_dns_servers:
– 10.255.255.255
searchdomains:
– intra.unetresgrossebite.com
– unetresgrossebite.com
additional_no_proxy: “*.intra.unetresgrossebite.com,10.42.0.0/15”
http_proxy: “http://netserv.vms.intra.unetresgrossebite.com:3128/”
https_proxy: “{{ http_proxy }}”
download_validate_certs: False
cert_management: script
download_container: true
deploy_container_engine: true
apiserver_loadbalancer_domain_name: api-k8s.intra.unetresgrossebite.com
loadbalancer_apiserver:
  address: 10.42.253.152
  port: 6443
loadbalancer_apiserver_localhost: false
loadbalancer_apiserver_port: 6443

We would also want to customize the variables in group_vars/k8s-cluster/k8s-cluster.yml:

kube_config_dir: /etc/kubernetes
kube_script_dir: “{{ bin_dir }}/kubernetes-scripts”
kube_manifest_dir: “{{ kube_config_dir }}/manifests”
kube_cert_dir: “{{ kube_config_dir }}/ssl”
kube_token_dir: “{{ kube_config_dir }}/tokens”
kube_users_dir: “{{ kube_config_dir }}/users”
kube_api_anonymous_auth: true
kube_version: v1.18.3
kube_image_repo: “k8s.gcr.io”
local_release_dir: “/tmp/releases”
retry_stagger: 5
kube_cert_group: kube-cert
kube_log_level: 2
credentials_dir: “{{ inventory_dir }}/credentials”
kube_api_pwd: “{{ lookup(‘password’, credentials_dir + ‘/kube_user.creds length=15 chars=ascii_letters,digits’) }}”
kube_users:
  kube:
    pass: “{{ kube_api_pwd }}”
    role: admin
    groups:
    – system:masters
kube_oidc_auth: false
kube_basic_auth: true
kube_token_auth: true
kube_network_plugin: calico
kube_network_plugin_multus: false
kube_service_addresses: 10.233.0.0/18
kube_pods_subnet: 10.233.64.0/18
kube_network_node_prefix: 24
kube_apiserver_ip: “{{ kube_service_addresses|ipaddr(‘net’)|ipaddr(1)|ipaddr(‘address’) }}”
kube_apiserver_port: 6443
kube_apiserver_insecure_port: 0
kube_proxy_mode: ipvs
# using metallb, set to true
kube_proxy_strict_arp: false
kube_proxy_nodeport_addresses: []
kube_encrypt_secret_data: false
cluster_name: cluster.local
ndots: 2
kubeconfig_localhost: true
kubectl_localhost: true
dns_mode: coredns
enable_nodelocaldns: true
nodelocaldns_ip: 169.254.25.10
nodelocaldns_health_port: 9254
enable_coredns_k8s_external: false
coredns_k8s_external_zone: k8s_external.local
enable_coredns_k8s_endpoint_pod_names: false
system_reserved: true
system_memory_reserved: 512M
system_cpu_reserved: 500m
system_master_memory_reserved: 256M
system_master_cpu_reserved: 250m
deploy_netchecker: false
skydns_server: “{{ kube_service_addresses|ipaddr(‘net’)|ipaddr(3)|ipaddr(‘address’) }}”
skydns_server_secondary: “{{ kube_service_addresses|ipaddr(‘net’)|ipaddr(4)|ipaddr(‘address’) }}”
dns_domain: “{{ cluster_name }}”
kubelet_deployment_type: host
helm_deployment_type: host
kubeadm_control_plane: false
kubeadm_certificate_key: “{{ lookup(‘password’, credentials_dir + ‘/kubeadm_certificate_key.creds length=64 chars=hexdigits’) | lower }}”
k8s_image_pull_policy: IfNotPresent
kubernetes_audit: false
dynamic_kubelet_configuration: false
default_kubelet_config_dir: “{{ kube_config_dir }}/dynamic_kubelet_dir”
dynamic_kubelet_configuration_dir: “{{ kubelet_config_dir | default(default_kubelet_config_dir) }}”
authorization_modes:
– Node
– RBAC
podsecuritypolicy_enabled: true
container_manager: containerd
resolvconf_mode: none
etcd_deployment_type: host

Finally, we may enable additional components in group_vars/k8s-cluster/addons.yml:

dashboard_enabled: true
helm_enabled: false

registry_enabled: false
registry_namespace: kube-system
registry_storage_class: rwx-storage
registry_disk_size: 500Gi

metrics_server_enabled: true
metrics_server_kubelet_insecure_tls: true
metrics_server_metric_resolution: 60s
metrics_server_kubelet_preferred_address_types: InternalIP

cephfs_provisioner_enabled: true
cephfs_provisioner_namespace: cephfs-provisioner
cephfs_provisioner_cluster: ceph
cephfs_provisioner_monitors: “10.42.253.110:6789,10.42.253.111:6789,10.42.253.112:6789”
cephfs_provisioner_admin_id: admin
cephfs_provisioner_secret: key returned by ‘ceph auth get client.admin’
cephfs_provisioner_storage_class: rwx-storage
cephfs_provisioner_reclaim_policy: Delete
cephfs_provisioner_claim_root: /volumes
cephfs_provisioner_deterministic_names: true

rbd_provisioner_enabled: true
rbd_provisioner_namespace: rbd-provisioner
rbd_provisioner_replicas: 2
rbd_provisioner_monitors: “10.42.253.110:6789,10.42.253.111:6789,10.42.253.112:6789”
rbd_provisioner_pool: kube
rbd_provisioner_admin_id: admin
rbd_provisioner_secret_name: ceph-secret-admin
rbd_provisioner_secret: key retured by ‘ceph auth get client.admin’
rbd_provisioner_user_id: kube
rbd_provisioner_user_secret_name: ceph-secret-user
rbd_provisioner_user_secret: key returned by ‘ceph auth gt client.kube’
rbd_provisioner_user_secret_namespace: “{{ rbd_provisioner_namespace }}”
rbd_provisioner_fs_type: ext4
rbd_provisioner_image_format: “2”
rbd_provisioner_image_features: layering
rbd_provisioner_storage_class: rwo-storage
rbd_provisioner_reclaim_policy: Delete

ingress_nginx_enabled: true
ingress_nginx_host_network: true
ingress_publish_status_address: “”
ingress_nginx_nodeselector:
  node-role.kubernetes.io/infra: “true”
ingress_nginx_namespace: ingress-nginx
ingress_nginx_insecure_port: 80
ingress_nginx_secure_port: 443
ingress_nginx_configmap:
  map-hash-bucket-size: “512”

cert_manager_enabled: true
cert_manager_namespace: cert-manager

We now have pretty much everything ready. Last, we would deploy some haproxy node, proxying requests to Kubernetes API. To do so, I would use a pair of VMs, with keepalived and haproxy. On both, install necessary packages and configuration:

apt-get update ; apt-get install keepalived haproxy hatop
cat << EOF>/etc/keepalived/keepalived.conf
global_defs {
  notification_email {
    contact@example.com
  }
 notification_email_from keepalive@$(hostname -f)
  smtp_server smtp.example.com
  smtp_connect_timeout 30
}

vrrp_instance VI_1 {
  state MASTER
  interface ens3
  virtual_router_id 101
  priority 10
  advert_int 101
  authentication {
    auth_type PASS
    auth_pass your_secret
  }
  virtual_ipaddress {
  10.42.253.152
  }
}
EOF
echo net.ipv4.conf.all.forwarding=1 >>/etc/sysctl.conf
sysctl -w net.ipv4.conf.all.forwarding=1
systemctl restart keepalived && systemctl enable keepalived
#hint: use distinct priorities on nodes
cat << EOF>/etc/haproxy/haproxy.cfg
global
  log /dev/log local0
  log /dev/log local1 notice
  chroot /var/lib/haproxy
  stats socket /run/haproxy/admin.sock mode 660 level admin expose-fd listeners
  stats timeout 30s
  user haproxy
  group haproxy
  daemon
  ca-base /etc/ssl/certs
  crt-base /etc/ssl/private
  ssl-default-bind-ciphers ECDH+AESGCM:DH+AESGCM:ECDH+AES256:DH+AES256:ECDH+AES128:DH+AES:RSA+AESGCM:RSA+AES:!aNULL:!MD5:!DSS
  ssl-default-bind-options no-sslv3

defaults
  log global
  option dontlognull
  timeout connect 5000
  timeout client 50000
  timeout server 50000
  errorfile 400 /etc/haproxy/errors/400.http
  errorfile 403 /etc/haproxy/errors/403.http
  errorfile 408 /etc/haproxy/errors/408.http
  errorfile 500 /etc/haproxy/errors/500.http
  errorfile 502 /etc/haproxy/errors/502.http
  errorfile 503 /etc/haproxy/errors/503.http
  errorfile 504 /etc/haproxy/errors/504.http

listen kubernetes-apiserver-https
  bind 0.0.0.0:6443
  mode tcp
  option log-health-checks
  server master1 10.42.253.10:6443 check check-ssl verify none inter 10s
  server master2 10.42.253.11:6443 check check-ssl verify none inter 10s
  server master3 10.42.253.12:6443 check check-ssl verify none inter 10s
  balance roundrobin
EOF
systemctl restart haproxy && systemctl enable haproxy
cat << EOF>/etc/profile.d/hatop.sh
alias hatop=’hatop -s /run/haproxy/admin.sock’
EOF

We may now deploy our cluster:

ansible -i path/to/inventory cluster.yml

For a 10 nodes cluster, it shouldn’t take more than an hour.
It is quite nice, to see you can have some reliable Kubernetes deployment, with less than 60 infra Pods.

I’m also noticing that while the CSI provisioner is being used, creating Ceph RBD and CephFS volumes: the host is still in charge of mounting our those volumes – which is, in a way, a workaround to the CSI attacher plugins.
Although, on that note, I’ve heard those issues with blocked volumes during nodes failures was in its way to being solved, involving a fix to the CSI spec.
Sooner or later, we should be able to use the full CSI stack.

All in all, kube-spray is quite a satisfying solution.
Having struggled quite a lot with openshift-ansible, and not quite yet satisfied with their lasts installer, kube-spray definitely feels like some reliable piece of software, code is well organized, it goes straight to the point, …
Besides, I need a break from CentOS. I’m amazed I did not try it earlier.
Docker Images Vulnerability Scan

While several solutions exist scanning Docker images, I’ve been looking for one that I could deploy and use on OpenShift, integrated into my existing CI chain.

The most obvious answer, working with opensource, would be OpenSCAP. Although I’m still largely working with Debian, while OpenSCAP would only check for CentOS databases.

Another popular contender on the market is Twistlock, but I’m not interested in solutions I can’t deploy myself without requesting for “a demo” or talking to people in general.

Eventually, I ended up deploying Clair, an open source product offered by CoreOS, providing with an API.
It queries popular vulnerabilities databases populating its own SQL database, and can then analyze Docker image layers posted to its API.

We could deploy Clair to OpenShift, alongside its Postgres database, using that Template.

The main issue I’ve had with Clair, so far, was that the client, clairctl, relies on Docker socket access, which is not something you would grant any deployment in OpenShift.
And since I wanted to scan my images as part of Jenkins pipelines, I would have my Jenkins master creating scan agents. Allowing Jenkins creating containers with host filesystem access is, in itself, a security issue, as any user that could create a Job scheduling agents with full access to my OpenShift nodes.

Introducing Klar. A project I found on GitHub, go-based, that can scan images against a Clair service, without any special privileges, besides pulling the Docker image out of your registry, and posting layers to Clair.

We would build a Jenkins agent re-using OpenShift base image, shipping with Klar.

Having build our Jenkins agent image, we can write another BuildConfig, defining a Parameterized Pipeline.

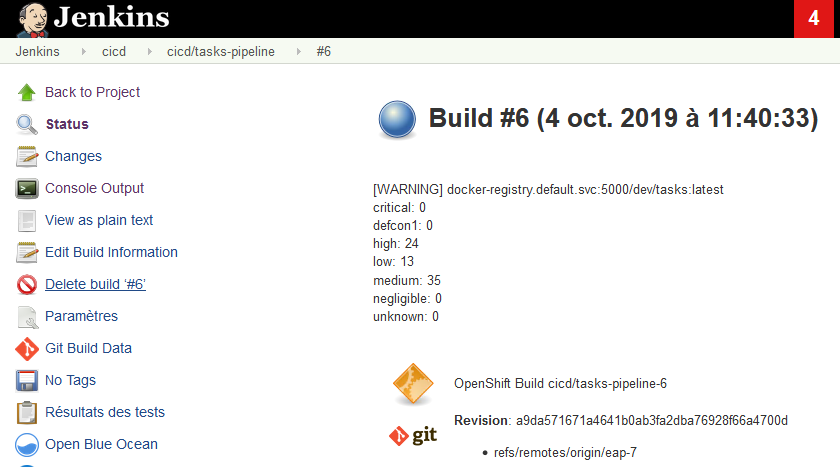
Jenkins CoreOS Clair Scan

Jenkins CoreOS Clair Scan

OpenShift Egress Traffic Management

Today, I’m investigating yet another OpenShift feature: Egress Routers. We would look at how to ensure a given connection leaves our cluster using a given IP address, integrating OpenShift with existing services that would be protected by some kind of IP filter.


First, let’s explain the default behavior of OpenShift.

Deployments are scheduled on OpenShift hosts, eventually leading to containers being started on those nodes.

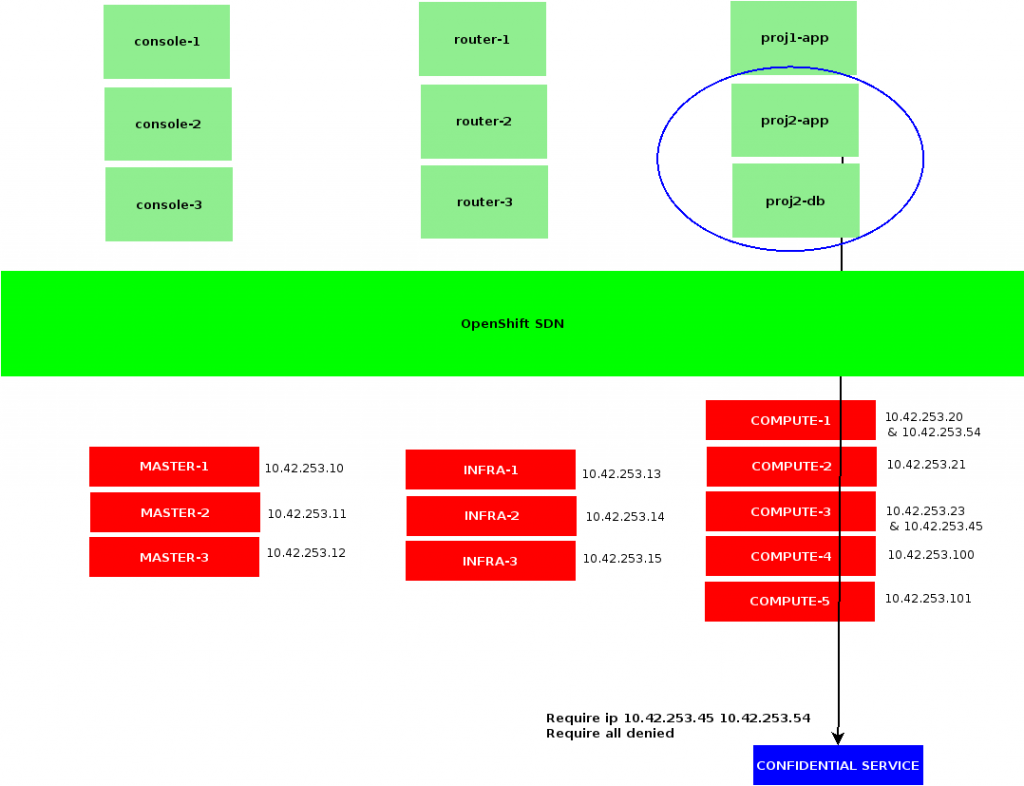
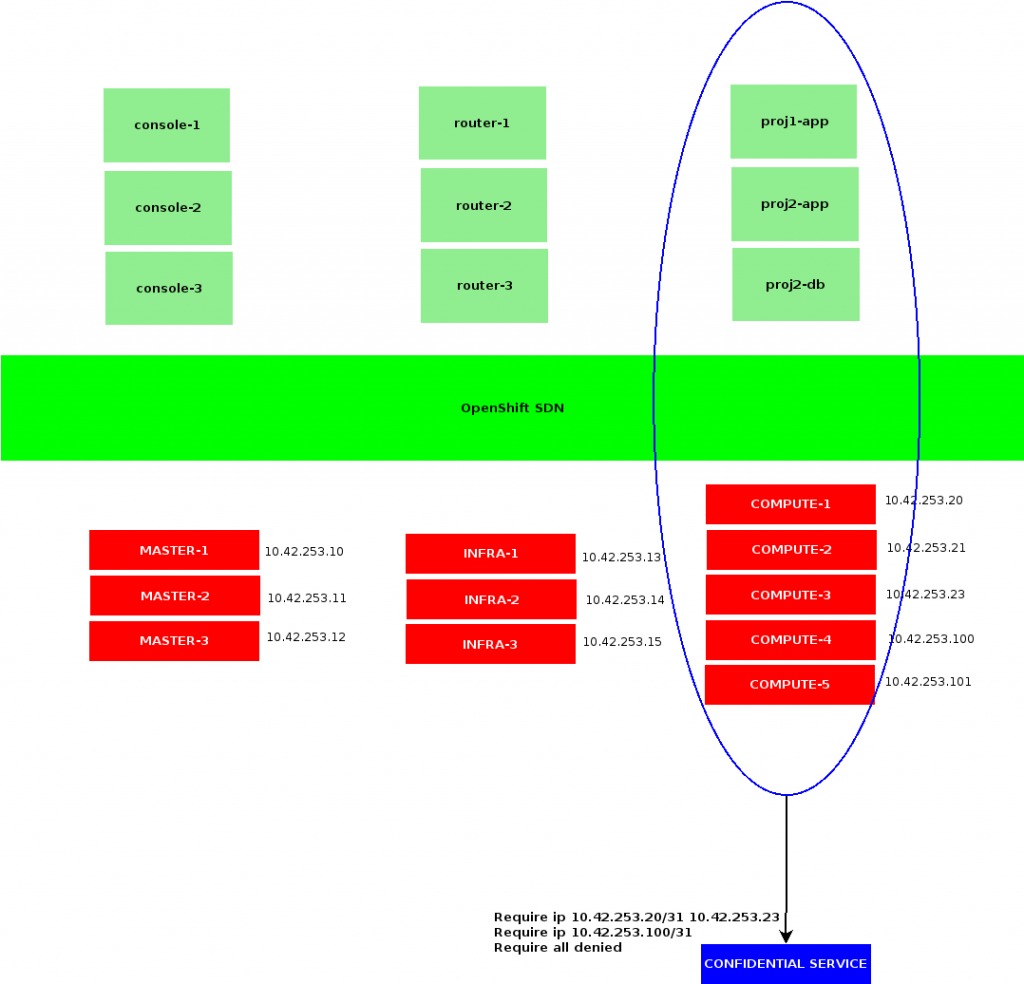
Filtering OpenShift compute hosts IPs

Filtering OpenShift compute hosts IPs

Whenever contacting a service outside OpenShift SDN, a container would exit OpenShift network through the node it’s been started on. Meaning the corresponding connection would get NAT-ed using the node IP our container currently is.

As such, a straight forward way of allowing OpenShift containers to reach a protected service could be to trust all my OpenShift hosts IP addresses connecting to those services.

Note that this sample implies trusting all containers that may be scheduled on those OpenShift nodes, contacting our remote service. It could be acceptable in a few cases, although whenever OpenShift is shared among multiple users or tenants, it usually won’t.

While we could address this by dedicating OpenShift nodes to users requiring access to a same set of protected resources, we would remain limited by the amount of OpenShift nodes composing our cluster.


Instead of relying on OpenShift nodes addresses, we could involve additional addresses dedicated to accessing external resources.

A first way to implement this would be to allocate an OpenShift namespace with its own Egress IPs:

$ oc patch netnamespace toto -p ‘{“egressIPs”: [“10.42.253.45″,”10.42.253.54”]}’

Such configuration would also require us to associate these egress IPs to OpenShift nodes’ hostsubnet:

$ oc patch hostsubnet compute3 -p ‘{“egressIPs”: [“10.42.253.45”]}’

$ oc patch hostsubnet compute1 -p ‘{“egressIPs”: [“10.42.253.54”]}’

Then, from a Pod of our toto netnamespace, we could try to reach a remote service:

$ oc rsh -n toto jenkins-1-xyz
sh-4.2$ ping 8.8.8.8
[…]
64 bytes from 8.8.8.8: icmp_seq=90 ttl=119 time=4.01 ms
64 bytes from 8.8.8.8: icmp_seq=91 ttl=119 time=4.52 ms
^C
— 8.8.8.8 ping statistics —
91 packets transmitted, 89 received, 2% packet loss, time 90123ms
rtt min/avg/max/mdev = 3.224/4.350/12.042/1.073 ms

Notice we did lost a few packets. The reason for this is that I rebooted the compute3 host, from which my ping was initially leaving the cluster. While the node was marked NotReady, traffic went through the second node, compute1, holding an egressIP associated to the toto netnamespace. From our gateway, we can confirm the new IP is temporarily being used:

# tcpdump -vvni vlan5 host 10.42.253.54
tcpdump: listening on vlan5, link-type EN10MB
13:11:13.066821 10.42.253.54 > 8.8.8.8: icmp: echo request (id:023e seq:3) [icmp cksum ok] (DF) (ttl 63, id 24619, len 84)
13:11:13.070596 arp who-has 10.42.253.54 tell 10.42.253.5
13:11:13.071194 arp reply 10.42.253.54 is-at 52:54:00:b1:15:b9
13:11:13.071225 8.8.8.8 > 10.42.253.54: icmp: echo reply (id:023e seq:3) [icmp cksum ok] [tos 0x4] (ttl 120, id 14757, len 84)
13:11:14.066796 10.42.253.54 > 8.8.8.8: icmp: echo request (id:023e seq:4) [icmp cksum ok] (DF) (ttl 63, id 25114, len 84)
13:11:14.069990 8.8.8.8 > 10.42.253.54: icmp: echo reply (id:023e seq:4) [icmp cksum ok] [tos 0x4] (ttl 120, id 515, len 84)

As soon as compute3 is done rebooting, tcpdump confirms 10.42.253.54 is no longer used.

Namespace-based IP Filtering

Namespace-based IP Filtering

From the router point of view, we can see that the hardware address for our Egress IPs match those of our OpenShift hosts:

# arp -na | grep 10.42.253
[…]
10.42.253.20 52:54:00:b1:15:b9 vlan5 19m49s
10.42.253.21 52:54:00:6b:99:ad vlan5 19m49s
10.42.253.23 52:54:00:23:1c:4f vlan5 19m54s
10.42.253.45 52:54:00:23:1c:4f vlan5 7m36s
10.42.253.54 52:54:00:b1:15:b9 vlan5 10m35s

As such, this configuration may be preferable whenever the network hosting OpenShift would not allow introducing virtual hardware addresses.

Note that usage for a node’s EgressIP is reserved to the netnamespaces specifically requesting them. Any other container executed on my compute1 and compute3 hosts are still being NAT-ed using 10.42.253.20 and 10.42.253.23 respectively.

Also note that namespace based IP filtering does not rely on any placement rule: containers could get started on any OpenShift node in your cluster, their traffic would still exit OpenShift SDN through a designated node, according to netnamespaces and hostsubnets configurations.

Bearing in mind that whenever the EgressIPs from your netnamespaces are no longer assigned to a node from your cluster – be that due to a missing configuration, or an outage affecting all your Egress hosts – then containers from the corresponding projects would no longer have access to resources out of OpenShift SDN.


Now that we’re familiar with the basics of OpenShift Egress traffic management, we can focus on Egress Routers.

Several Egress Routers implementation exist, we would focus on the couple most commons that are the Redirect mode, and the HTTP proxy mode.

In both cases, we would use a dedicated project hosting a router Pod:

$ oc new-project egress-routers

We would also rely on a ServiceAccount, that may start privileged containers:

$ oc create sa egress-init

As well as a SecurityContextContraint granting our ServiceAccount such privileges:

$ cat <<EOF >egress-scc.yml
kind: SecurityContextConstraints
apiVersion: v1
metadata: { name: egress-init }
allowPrivilegedContainer: true
runAsUser: { type: RunAsAny }
seLinuxContext: { type: RunAsAny }
fsGroup: { type: RunAsAny }
supplementalGroups: { type: RunAsAny }
users: [ “system:serviceaccount:egress-routers:egress-init” ]
EOF
$ oc create -f egress-scc.yml

Running a Redirect Egress Router, we would then create a controller ensuring a Pod would deal with configuring OpenShift SDN NAT-ing the traffic with a specific Egress IP:

$ cat <<EOF >redirect-router.yml
apiVersion: v1
kind: ReplicationController
metadata:
  name: egress-router
spec:
  replicas: 1
  selector:
    name: egress-router
  template:
    metadata:
      name: egress-router
      labels:
        name: egress-router
      annotations:
        pod.network.openshift.io/assign-macvlan: “true”
    spec:
      initContainers:
      – name: egress-demo-init
        image: docker.io/openshift/origin-egress-router
        env:
        – name: EGRESS_SOURCE
          value: 10.42.253.46
        – name: EGRESS_GATEWAY
          value: 10.42.253.1
        – name: EGRESS_DESTINATION
          value: 8.8.8.8
        – name: EGRESS_ROUTER_MODE
          value: init
        securityContext:
          privileged: true
        serviceAccountName: egress-init
      containers:
      – name: egress-demo-wait
        image: docker.io/openshift/origin-pod
      nodeSelector:
        node-role.kubernetes.io/infra: “true”
      serviceAccountName: egress-init
EOF
$ oc create -f redirect-router.yml

Note we are first starting an init container setting up proper iptalbes rules using a few variables. EGRESS_SOURCE is an arbitrary and un-allocated IP address in OpenShift subnet, EGRESS_GATEWAY is our default gateway and EGRESS_DESTINATION the remote address our Egress router would forward its traffic to.

Once our init container is done updating iptables configuration, it is shut down and replaced by our main pod, that would not do anything.

At that point, we could enter that Pod, and see that all its traffic exit OpenShift subnet being NAT-ed with our EGRESS_SOURCE IP, by the OpenShift host executing our container.

From the network gateway point of view, we could notice our EGRESS_SOURCE_IP address is associated to a virtual hardware address:

# arp -na | grep 10.42.253
[…]
10.42.253.46 d6:76:cc:f4:e3:d9 vlan5 19m34s

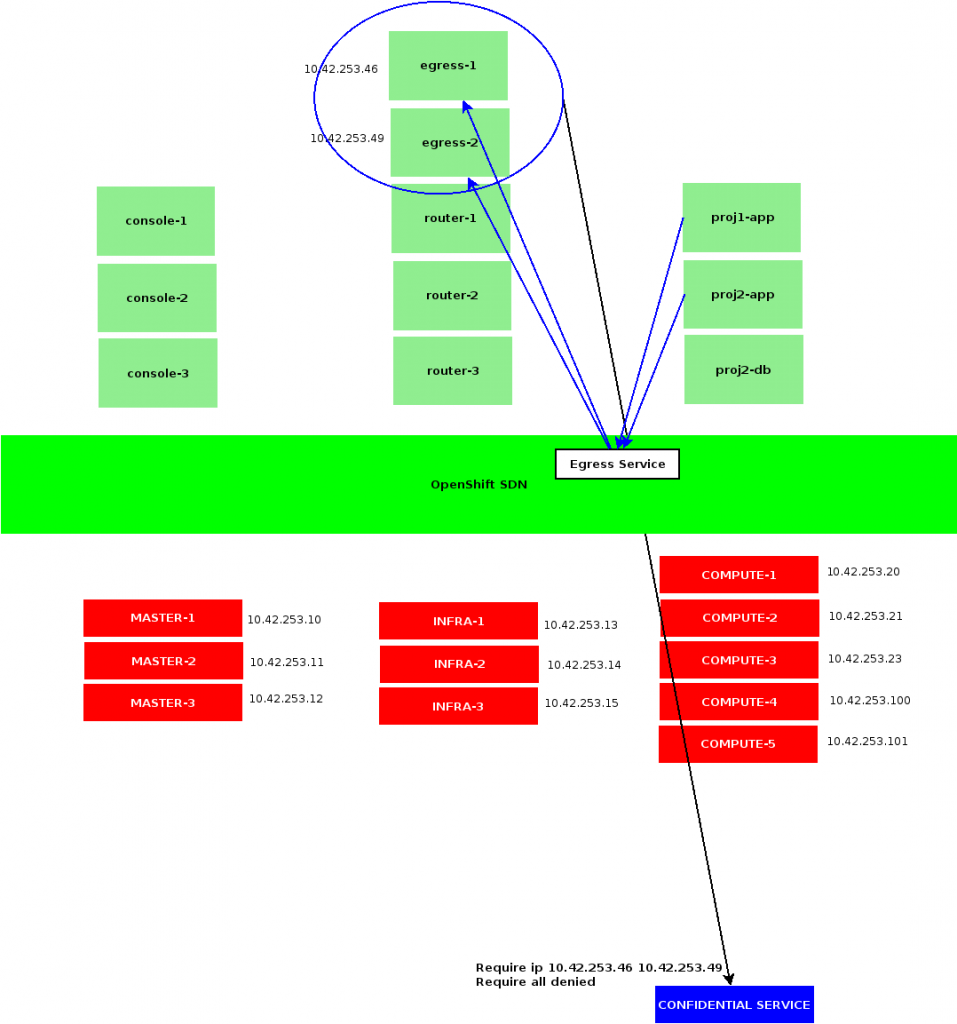
Contrarily to namespace-scoped Egress IPs, Egress Routers may be scheduled anywhere on OpenShift cluster, according to an arbitrary  – and optional – placement rule. Although it relies on containers, which might take a few seconds to start depending on images being available in Docker local caches. Another drawback being that a single IP can not be shared among several routers, we would not be able to scale them.

To offer with redundancy, we could however setup several Egress Routers per protected service, using distinct EGRESS_SOURCE, and sharing the same EGRESS_DESTINATION.

While we’ve seen our Egress Router container exits our cluster to any remotes using our designated EGRESS_SOURCE address, let’s now look at how to use that router from other OpenShift hosted containers. First, we would create a service identifying our Egress Routers:

$ oc create service –name egress-redirect –namespace egress-routers –port=53 –selector=name=egress-router

Depending on your network plugin we would have to allow traffic coming to that service from third-party Projects. We would then be able to query our EGRESS_DESTINATION through our service:

$ curl http://egress-redirect.egress-routers.svc:53/

From our gateway, we could see the corresponding traffic leaving OpenShift SDN, NAT-ed using our EGRESS_SOURCE:

# tcpdump -vvni vlan5 host 8.8.8.8
tcpdump: listening on vlan5, link-type EN10MB
11:11:53.357775 10.42.253.46.53084 > 8.8.8.8.53: S [tcp sum ok] 1167661839:1167661839(0) win 28200 <mss 1410,sackOK,timestamp 84645569 0,nop,wscale 7> (DF)
11:11:54.357948 10.42.253.46.53084 > 8.8.8.8.53: S [tcp sum ok] 1167661839:1167661839(0) win 28200 <mss 1410,sackOK,timestamp 84646572 0,nop,wscale 7> (DF)
11:11:56.361964 10.42.253.46.53084 > 8.8.8.8.53: S [tcp sum ok] 1167661839:1167661839(0) win 28200 <mss 1410,sackOK,timestamp 84648576 0,nop,wscale 7> (DF)

Redirect Egress Routers

Redirect Egress Routers

Note that the EGRESS_DESTINATION definition may include more than a single address, depending on the protocol and port queried, we could route those connections to distinct remotes:

env:
– name: EGRESS_DESTINATION
  value: |
    80 tcp 203.0.113.25
    8080 tcp 203.0.113.26 80
    8443 tcp 203.0.113.26 443
    203.0.113.27

That snippet would ensure that connections to our router pod on TCP port 80 would be sent to a first remote address, while those to 8080 and 8443 are translated to ports 80 and 443 respectively of a second address, and any other traffic sent to a third remote address.

We could very well set these into a ConfigMap, to eventually include from our Pods configuration, ensuring consistency among a set of routers.

Obviously from OpenShift containers point of view, instead of connecting to our remote service, we would have to reach our Egress Router Service, which would in turn ensure proper forwarding of our requests.


Note that Redirect Egress Routers are limited to TCP and UDP traffic, while usually not recommended dealing with HTTP communications. That later case is best suited for the HTTP Proxy Egress Routers, relying on Squid.

Although very similar to Redirect Egress Routers, the HTTP Proxy would not set an EGRESS_DESTINATION environment variable on its init containers, and would instead pass an EGRESS_HTTP_PROXY_DESTINATION to the main container, such as:

$ cat <<EOF >egress-http.yml
apiVersion: v1
kind: ReplicationController
metadata:
  name: egress-http
spec:
  replicas: 1
  selector:
    name: egress-http
  template:
    metadata:
      name: egress-http
      labels:
        name: egress-http
      annotations:
        pod.network.openshift.io/assign-macvlan: “true”
    spec:
      initContainers:
      – name: egress-demo-init
        image: openshift/origin-egress-router
        env:
        – name: EGRESS_SOURCE
          value: 10.42.253.43
        – name: EGRESS_GATEWAY
          value: 10.42.253.1
        – name: EGRESS_ROUTER_MODE
          value: http-proxy
        securityContext:
          privileged: true
        serviceAccountName: egress-init
      containers:
      – name: egress-demo-proxy
        env:
        – name: EGRESS_HTTP_PROXY_DESTINATION
          value: |
            !perdu.com
            !*.perdu.com
            !10.42.253.0/24
            *
        image: openshift/origin-egress-http-proxy
      nodeSelector:
        node-role.kubernetes.io/infra: “true”
      serviceAccountName: egress-init
EOF
$ oc create -f egress-http.yml

Note the EGRESS_HTTP_PROXY_DESTINATION definition allows us to deny access to specific resources, such as perdu.com and its subdomain or an arbitrary private subnet, while we would allow any other communication with a wildcard.

By default, the Egress HTTP Proxy image listens on TCP port 8080, which allows us to create a service such as the following:

$ oc create service –name egress-http –namespace egress-routers –port=8080 –selector=egress-http

And eventually use that service from other OpenShift containers, based on environment variable proper definition:

$ oc rsh -n too jenkins-1-xyz
sh-4.2$ $ https_proxy=http://egress-http.egress-routers.svc:8080 http_proxy=http://egress-http.egress-routers.svc:8080/ curl -vfsL http://free.fr -o /dev/null
[… 200 OK …]
sh-4.2$ https_proxy=http://egress-http.egress-routers.svc:8080 http_proxy=http://egress-http.egress-routers.svc:8080/ curl -vfsL http://perdu.com -o /dev/null
[… 403 forbidden …]

As for our Redirect Egress Router, running tcpdump on our gateway would confirm traffic is properly NAT-ed:

# tcpdump -vvni vlan5 host 10.42.253.43
[…]
12:11:37.385219 212.27.48.10.443 > 10.42.253.43.55906: . [bad tcp cksum b96! -> 9b9f] 3563:3563(0) ack 446 win 30016 [tos 0x4] (ttl 63, id 1503, len 40)
12:11:37.385332 212.27.48.10.443 > 10.42.253.43.55906: F [bad tcp cksum b96! -> 9ba0] 3562:3562(0) ack 445 win 30016 [tos 0x4] (ttl 63, id 40993, len 40)
12:11:37.385608 10.42.253.43.55908 > 212.27.48.10.443: . [tcp sum ok] 472:472(0) ack 59942 win 64800 (DF) (ttl 64, id 1694, len 40)
12:11:37.385612 10.42.253.43.55906 > 212.27.48.10.443: . [tcp sum ok] 446:446(0) ack 3563 win 40320 (DF) (ttl 64, id 1695, len 40)

While our router ARP table would show records similar to Redirect Egress Router ones:

# arp -na | grep 10.42.253.43
10.42.253.43 d2:87:15:45:1c:28 vlan5 18m52s

Depending on security requirements and the kind of service we want to query, OpenShift is pretty flexible. Although the above configurations do not represent an exhaustive view of existing implementations, we did cover the most basic use cases from OpenShift documentations, which are more likely to remain supported.

Whenever possible, using namespace-scoped IPs seems to be easier, as it would not rely on any other service than OpenShift SDN applying proper routing and NAT-ing. Try to offer with several IPs per namespaces, allowing for quick failover, should a node become unavailable.

If port-based filtering is required, then Redirect Routers are more likely to satisfy, although deploying at least two Pods, using two distinct Egress IPs and node selectors would be recommended, as well as sharing a ConfigMap defining outbound routing.

Similarly, HTTP Proxy Routers would be recommended proxying HTTP traffic, as it would not require anything else than setting a few environment variables and ensuring our runtime does observe environment-based proxy configuration.


Signing and Scanning Docker Images with OpenShift

You may already know Docker images can be signed. Today we would discuss a way to automate images signature, using OpenShift.

Lately, I stumbled upon a bunch of interesting repositories:

  • https://github.com/redhat-cop/openshift-image-signing-scanning: ansible playbook configuring an OCP cluster, building a base image, setting up a service account and installing a few templates providing with docker images scanning and signing
  • https://github.com/redhat-cop/image-scanning-signing-service: an optional OpenShift third-party service implementing support for ImageSigningRequest and ImageScanningRequest objects
  • https://github.com/redhat-cop/openshift-event-controller: sources building an event controller that would watch for new images pushed to OpenShift docker registry
  • Although these are amazing, I could not deploy them to my OpenShift Origin, due to missing subscriptions and packages.

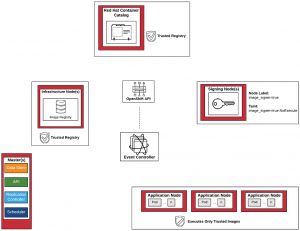
    image signing environment overview

    image signing environment overview

    In an effort to introduce CentOS support, I forked the first repository from our previous list, and started rewriting what I needed:

    https://github.com/faust64/openshift-image-signing-scanning


    A typical deployment would involve:

  • Generating a GPG keypair on some server (not necessarily related to OpenShift)
  • Depending on your usecase, we could then want to configure docker to prevent unsigned images from being run on our main OpenShift hosts
  • Next, we would setup labels and taints identifying the nodes we trust signing images, as well as apply and install a few templates and a base image
  • At which point, you could either install the event-controller Deployment to watch for all your OpenShift internal registry’s images.

    Or, you could integrate images scanning and signature yourself using the few templates installed, as shown in a sample Jenkinsfile.

    OpenShift Supervision

    Today I am looking back on a few topics I had a hard time properly deploying using OpenShift 3.7 and missing proper dynamic provisioning despite a poorly-configured GlusterFS cluster.
    Since then, I deployed a 3 nodes Ceph cluster, using Sebastien Han’s ceph-ansible playbooks, allowing me to further experiment with persistent volumes.
    And OpenShift Origin 3.9 also came out, shipping with various fixes and new features, such Gluster Block volumes support, that might address some of GlusterFS performances issues.


    OpenShift Ansible playbooks include a set of roles focused on collecting and making sense out of your cluster metrics, starting with Hawkular.

    We could set up a few Pods running Hawkular, Heapster to collect data from your OpenShift nodes and a Cassandra database to store them, defining the following variables and applying the playbooks/openshift-metrics/config.yml playbook:

    Hawkular

    Hawkular integration with OpenShift

    openshift_metrics_cassandra_limit_cpu: 3000m
    openshift_metrics_cassandra_limit_memory: 3Gi
    openshift_metrics_cassandra_node_selector: {“region”:”infra”}
    openshift_metrics_cassandra_pvc_prefix: hawkular-metrics
    openshift_metrics_cassandra_pvc_size: 40G
    openshift_metrics_cassandra_request_cpu: 2000m
    openshift_metrics_cassandra_request_memory: 2Gi
    openshift_metrics_cassandra_storage_type: pv
    openshift_metrics_cassandra_pvc_storage_class_name: ceph-storage
    openshift_metrics_cassanda_pvc_storage_class_name: ceph-storage

    openshift_metrics_image_version: v3.9
    openshift_metrics_install_metrics: True
    openshift_metrics_duration: 14
    openshift_metrics_hawkular_limits_cpu: 3000m
    openshift_metrics_hawkular_limits_memory: 3Gi
    openshift_metrics_hawkular_node_selector: {“region”:”infra”}
    openshift_metrics_hawkular_requests_cpu: 2000m
    openshift_metrics_hawkular_requests_memory: 2Gi
    openshift_metrics_heapster_limits_cpu: 3000m
    openshift_metrics_heapster_limits_memory: 3Gi
    openshift_metrics_heapster_node_selector: {“region”:”infra”}
    openshift_metrics_heapster_requests_cpu: 2000m
    openshift_metrics_heapster_requests_memory: 2Gi

    Note that we are defining both openshift_metrics_cassandra_pvc_storage_class_name and openshit_metrics_cassanda_pvc_storage_class_name due to a typo that was recently fixed, yet not in OpenShift Origin last packages.

    Setting up those metrics may allow you to create Nagios commands based on querying for resources allocations and consumptions, using:

    $ oc adm top node –heapster-namespacce=openshift-infra –heapster-scheme=https node.example.com


    Another solution that integrates well with OpenShift is Prometheus, that could be deployed using the playbooks/openshift-prometheus/config.yml playbook and those Ansible variables:

    Prometheus

    Prometheus showing OpenShift Pods CPU usages

    openshift_prometheus_alertbuffer_pvc_size: 20Gi
    openshift_prometheus_alertbuffer_storage_class: ceph-storage
    openshift_prometheus_alertbuffer_storage_type: pvc
    openshift_prometheus_alertmanager_pvc_size: 20Gi
    openshift_prometheus_alertmanager_storage_class: ceph-storage
    openshift_prometheus_alertmanager_storage_type: pvc
    openshift_prometheus_namespace: openshift-metrics
    openshift_prometheus_node_selector: {“region”:”infra”}
    openshift_prometheus_pvc_size: 20Gi
    openshift_prometheus_state: present
    openshift_prometheus_storage_class: ceph-storage
    openshift_prometheus_storage_type: pvc


    We could also deploy some Grafana, that could include a pre-configured dashboard, rendering some Prometheus metrics – thanks to the playbooks/openshift-grafana/config.yml playbook and the following Ansible variables:

    Grafana

    OpenShift Dashboard on Grafana

    openshift_grafana_datasource_name: prometheus
    openshift_grafana_graph_granularity: 2m
    openshift_grafana_namespace: openshift-grafana
    openshift_grafana_node_exporter: True
    openshift_grafana_node_selector: {“region”:”infra”}
    openshift_grafana_prometheus_namespace: openshift-metrics
    openshift_grafana_prometheus_serviceaccount: prometheus
    openshift_grafana_storage_class: ceph-storage
    openshift_grafana_storage_type: pvc
    openshift_grafana_storage_volume_size: 15Gi


    And finally, we could also deploy logs centralization with the playbooks/openshift-logging/config.yml playbook, setting the following:

    Kibana

    Kibana integration with EFK

    openshift_logging_install_logging: True
    openshift_logging_curator_default_days: ‘7’
    openshift_logging_curator_cpu_request: 100m
    openshift_logging_curator_memory_limit: 256Mi
    openshift_logging_curator_nodeselector: {“region”:”infra”}
    openshift_logging_elasticsearch_storage_type: pvc
    openshift_logging_es_cluster_size: ‘1’
    openshift_logging_es_cpu_request: ‘1’
    openshift_logging_es_memory_limit: 8Gi
    openshift_logging_es_pvc_storage_class_name: ceph-storage
    openshift_logging_es_pvc_dynamic: True
    openshift_logging_es_pvc_size: 25Gi
    openshift_logging_es_recover_after_time: 10m
    openshift_logging_es_nodeslector: {“region”:”infra”}
    openshift_logging_es_number_of_shards: ‘1’
    openshift_logging_es_number_of_replicas: ‘0’
    openshift_logging_fluentd_buffer_queue_limit: 1024
    openshift_logging_fluentd_buffer_size_limit: 1m
    openshift_logging_fluentd_cpu_request: 100m
    openshift_logging_fluentd_file_buffer_limit: 256Mi
    openshift_logging_fluentd_memory_limit: 512Mi
    openshift_logging_fluentd_nodeselector: {“region”:”infra”}
    openshift_logging_fluentd_replica_count: 2
    openshift_logging_kibana_cpu_request: 600m
    openshift_logging_kibana_hostname: kibana.router.intra.unetresgrossebite.com
    openshift_logging_kibana_memory_limit: 736Mi
    openshift_logging_kibana_proxy_cpu_request: 200m
    openshift_logging_kibana_proxy_memory_limit: 256Mi
    openshift_logging_kibana_replica_count: 2
    openshift_logging_kibana_nodeselector: {“region”:”infra”}


    Meanwhile we could note that cri-o is getting better support in the latter versions of OpenShift, among a never-ending list of ongoing works and upcoming features.

    Graphite & Riemann

    There are several ways of collecting runtime metrics out of your software. We’ve discussed of Munin or Datadog already, we could talk about Collectd as well, although these solutions would mostly aim at system monitoring, as opposed to distributed systems.

    Business Intelligence may require collecting metrics from a cluster of workers, aggregating them into comprehensive graphs, such as short-living instances won’t imply a growing collection of distinct graphs.


    Riemann is a Java web service, allowing to collect metrics over TCP or UDP, and serving with a simple web interface generating dashboards, displaying your metrics as they’re received. Configuring Riemann, you would be able to apply your input with transformations, filtering, … You may find a quickstart here, or something more exhaustive over there. A good starting point could be to keep it simple:

    (logging/init {:file “/var/log/riemann/riemann.log”})
    (let [host “0.0.0.0”]
    (tcp-server {:host host})
    (ws-server {:host host}))
    (periodically-expire 5)
    (let [index (index)] (streams (default :ttl 60 index (expired (fn [event] (info “expired” event))))))

    Riemann Sample Dashboard

    Riemann Sample Dashboard

    Despite being usually suspicious of Java applications or Ruby web services, I tend to trust Riemann even under heavy workload (tens of collectd, forwarding hundreds of metrics per second).

    Riemann Dashboard may look unappealing at first, although you should be able to build your own monitoring screen relatively easily. Then again, this would require a little practice, and some basic sense of aesthetics.


    Graphite Composer

    Graphite Composer

    Graphite is a Python web service providing with a minimalist yet pretty powerful browser-based client, that would allow you to render graphs. Basic Graphite setup would usually involve some SQlite database storing your custom graphs and users, as long as another Python service: Carbon, storing metrics. Such setup would usually also involve Statsd, a NodeJS service listening for metrics, although depending on what you intend to monitor, you might find your way into writing to Carbon directly.

    Setting up Graphite on Debian Stretch may be problematic, due to some python packages being deprecated, while the last Graphite packages aren’t available yet. After unsuccessfully trying to pull copies from PIP instead of APT, I eventually ended up setting my first production instance based on Devuan Jessie. Setup process would drastically vary based on distribution, versions, your web server, Graphite database, … Should you go there: consider all options carefully before starting.

    Graphite could be used as is: the Graphite Composer would let you generate and save graphs, aggregating any collected metric, while the Dashboard view would let you aggregate several graphs into a single page. Although note you could use Graphite as part of Grafana as well, among others.


    From there, note Riemann can be reconfigured forwarding everything to Graphite (or using your own filters), adding to your riemann.config:

    (def graph (graphite {:host “10.71.100.164”}))
    (streams graph)

    This should allow you to run Graphite without Statsd, having Riemann collecting metrics from your software and forwarding them into Carbon.


    The next step would be to configure your applications, forwarding data to Riemann (or Statsd, should you want to only use Graphite). Databases like Cassandra or Riak could forward some of their own internal metrics, using the right agent. Or, collecting BI metrics from your own code.

    Graphite Dashboard

    Graphite Dashboard

    Using NodeJS, you will find a riemannjs module that does the job. Or node-statsd-client, for Statsd.

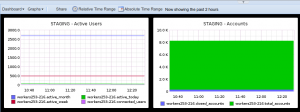
    Having added some scheduled tasks to our code, querying for how many accounts we have, how many are closed, how many were active during the last day, week and month, … I’m eventually able to create a dashboard based on saved graphs, aggregating metrics in some arguably-meaningful fashion.

    Lying DNS

    As I was looking at alternative web browsers, with privacy in mind, I ended up installing Iridium (in two words: Chrome fork), tempted to try it out. I first went to Youtube, and after my first video, was being subjected to one of these advertisement sneaking in between videos, that horrible “skip add” button after a few seconds, … I was shocked enough, to open Chromium back.

    This is a perfect occasion to discuss about lying DNS servers, and how having your own cache can help you clean up your web browsing experience from at least part of these unsolicited intrusions.

    We would mainly talk about a lying DNS server (or cache, actually) alongside Internet censorship, whenever an operator either refuses to serve DNS records or diverts them somewhere else.
    Yet some of the networks I manage may relay on DNS resolvers that would purposefully prevent some records from being resolved.

    You may query google for lists of domain names likely to host irrelevant contents. These are traditionally formatted as an hosts file, and may be used as is on your computer, assuming you won’t need serving these records to other stations in your LAN.

    Otherwise, servers such as Dnsmasq, Unbound or even Bind (using RPZ, although I would recommend sticking to Unbound) may be configured overwriting records for a given list of domains.
    Currently, I trust a couple sites to provide me with a relatively exhaustive list of unwanted domain names, using a script to periodically re-download these, while merging them with my own blacklist (see my puppet modules set for further details on how I configure Unbound). I wouldn’t recommend this to anyone: using dynamic lists is risky to begin with … Then again, I wouldn’t recommend a beginner to setup his own DNS server: editing your own hosts file could be a start, though.

    Instead of yet another conf dump, I’ld rather point to a couple posts I used when setting it up: the first one from Calomel (awesome source of sample configurations running on BSD, check it out, warmest recommendations …) and an other one from a blog I didn’t remember about – although I’ve probably found it at some point in the past, considering we pull domain names from the same sources…

    Wazuh

    As a follow-up to our previous OSSEC post, and to complete the one on Fail2ban & ELK, we’ll review today Wazuh.

    netstat alerts

    netstat alerts

    As their documentation states it, “Wazuh is a security detection, visibility, and compliance open source project. It was born as a fork of OSSEC HIDS, later was integrated with Elastic Stack and OpenSCAP evolving into a more comprehensive solution“. We could remark that OSSEC packages used to be distributed on some Wazuh repository, while Wazuh is still listed as OSSEC official training, deployment and assistance services provider. You might still want to clean up some defaults, as you would soon end up receiving notifications for any connection being established or closed …

    OSSEC is still maintained, last commit to their GitHub project was a couple days ago as of writing this post, while other commits are being pushed to Wazuh repository. If both products are still active, my last attempts configuring Kibana integration with OSSEC was a failure, due to Kibana5 not being supported. Considering Wazuh offers enterprise support, we could assume their sample configuration & ruleset are at least as relevant as those you’ld find with OSSEC.

    wazuh manager status

    wazuh manager status

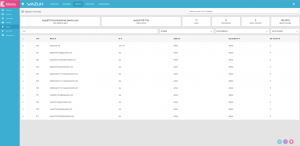
    Wazuh documentation is pretty straight-forward, a new service wazuh-api (NodeJS) would be required on your managers, which would then be used by Kibana querying Wazuh status. Debian packages were renamed from ossec-hids & ossec-hids-agent to wazuh-manager & wazuh-agent respectively. Configuration is somewhat similar, although you won’t be able to re-use those you could have installed alongside OSSEC. Note the wazuh-agent package would install an empty key file: you would need to drop it, prior to registering against your manager.


    wazuh-agents

    wazuh agents

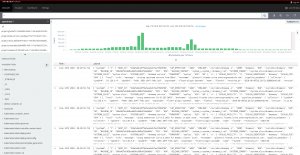
    Configuring Kibana integration, note Wazuh documentation misses some important detail, as reported on GitHub. That’s the single surprise I had reading through their documentation, the rest of their instructions work as expected: having installed and started wazuh-api service on your manager, then installed Kibana wazuh plugin on your all your Kibana instances, you would find some Wazuh menu showing on the left. Make sure your wazuh-alerts index is registered in the Management section, then go to Wazuh.

    If uninitialized, you would be offered to enter your Wazuh backend URL, a port, a username and corresponding password, connecting to wazuh-api. Note that configuration would be saved into some new .wazuh index. Once configured, you would have some live view of your setup, which agents are connected, what alerts you’re receiving, … eventually, set up new dashboards.

    Comparing this to OSSEC PHP web interface, marked as deprecated since years, … Wazuh takes the lead!

    CIS compliance

    CIS compliance

    OSSEC alerts

    OSSEC alerts

    Wazuh Overview

    Wazuh Overview

    PCI Compliance

    PCI Compliance

    KeenGreeper

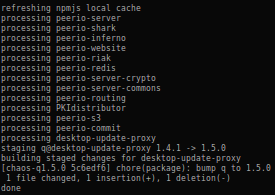
    Short post today, introducing KeenGreeper, a project I freshly released to GitHub, aiming to replace Greenkeeper 2.

    For those of you that may not be familiar with Greenkeeper, they provide with a public service that integrates with GitHub, detects your NodeJS projects dependencies and issues a pull request whenever one of these may be updated. In the last couple weeks, they started advertising about their original service being scheduled for shutdown, while Greenkeeper 2 was supposed to replace it. Until last week, I’ve only been using Greenkeeper free plan, allowing me to process a single private repository. Migrating to GreenKeeper 2, I started registering all my NodeJS repositories and only found out 48h later that it would cost me 15$/month, once they would have definitely closed the former service.

    Considering that they advertise on their website the new version offers some shrinkwrap support, while in practice outdated wrapped libraries are just left to rot, … I figured writing my own scripts collection would definitely be easier.

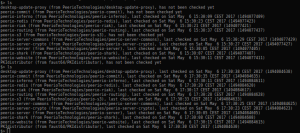
    keengreeper lists repositories, ignored packages, cached versions

    keengreeper lists repositories, ignored packages, cached versions

    That first release addresses the first basics, adding or removing repositories to some track list, adding or removing modules to some ignore list, preventing their being upgraded. Resolving the last version for a package from NPMJS repositories, and keeping these in a local cache. Works with GitHub as well as any ssh-capable git endpoint. Shrinkwrap libraries are actually refreshed, if such are present. Whenever an update is available, a new branch is pushed to your repository, named after the dependency and corresponding version.

    refresh logs

    refresh logs

    Having registered your first repositories, you may run the update job manually and confirm everything works. Eventually, setup a cron task executing our job script.

    Note that right now, it is assumed the user running these scripts has access to a SSH key granting it with write privileges to our repositories, pushing new branches. Now ideally, either you run this from your laptop and can assume using your own private key is no big deal, or I would recommend creating a third-party GitHub user, with its own SSH key pair, and grant it read & write access to the repositories you intend to have it work with.

    repositories listing

    repositories listing

    Being a 1 day DYI project, every feedback is welcome, GitHub is good place to start, …

    PM2

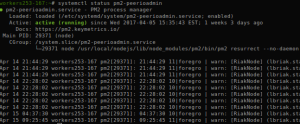
    systemctl integration

    systemctl integration

    PM2 is a NodeJS processes manager. Started on 2013 on GitHub, PM2 is currently the 82nd most popular JavaScript project on GitHub.


    PM2 is portable, and would work on Mac or Windows, as well as Unices. Integrated with Systemd, UpStart, Supervisord, … Once installed, PM2 would work as any other service.


    The first advantage of introducing PM2, whenever dealing with NodeJS services, is that you would register your code as a child service of your main PM2 process. Eventually, you would be able to reboot your system, and recover your NodeJS services without adding any scripts of your own.

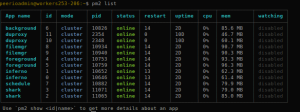
    pm2 processes list

    pm2 processes list

    Another considerable advantage of PM2 is that it introduces clustering capabilities, most likely without requiring any change to your code. Depending on how your application is build, you would probably want to have at least a couple processes for each service that serves users requests, while you could see I’m only running one copy of my background or schedule processes:


    nodejs sockets all belong to a single process

    nodejs sockets all belong to a single process

    Having enabled clustering while starting my foreground, inferno or filemgr processes, PM2 would start two instances of my code. Now one could suspect that, when configuring express to listen on a static port, starting two processes of that code would fail with some EADDRINUSE code. And that’s most likely what would happen, when instantiating your code twice. Yet when starting such process with PM2, the latter would take over socket operations:

    And since PM2 is processing network requests, during runtime: it is able to balance traffic to your workers. While when deploying new revisions of your code, you may gracefully reload your processes, one by one, without disrupting service at any point.

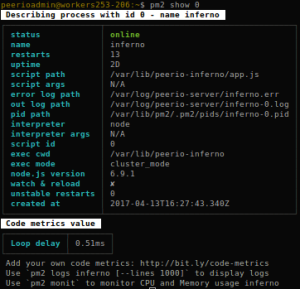
    pm2 process description

    pm2 process description

    PM2 also allows to track per-process resources usage:

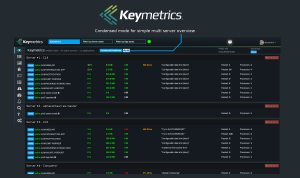
    Last but not least, PM2 provides with a centralized dashboard. Full disclosure: I only enabled this feature on one worker, once. And wasn’t much convinced, as I’m running my own supervision services, … Then again, you could be interested, if running a small fleet, or if ready to invest on Keymetrics premium features. Then again, it’s worth mentioning that your PM2 processes may be configured forwarding metrics to Keymetrics services, so you may keep an eye on memory or CPU usages, application versions, or even configure reporting, notifications, … In all fairness, I remember their dashboard looked pretty nice.

    pm2 keymetrics dashboard, as advertised on their site

    pm2 keymetrics dashboard, as advertised on their site