OpenShift Supervision
Today I am looking back on a few topics I had a hard time properly deploying using OpenShift 3.7 and missing proper dynamic provisioning despite a poorly-configured GlusterFS cluster.
Since then, I deployed a 3 nodes Ceph cluster, using Sebastien Han’s ceph-ansible playbooks, allowing me to further experiment with persistent volumes.
And OpenShift Origin 3.9 also came out, shipping with various fixes and new features, such Gluster Block volumes support, that might address some of GlusterFS performances issues.
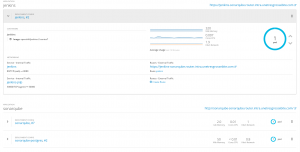
OpenShift Ansible playbooks include a set of roles focused on collecting and making sense out of your cluster metrics, starting with Hawkular.
We could set up a few Pods running Hawkular, Heapster to collect data from your OpenShift nodes and a Cassandra database to store them, defining the following variables and applying the playbooks/openshift-metrics/config.yml playbook:
openshift_metrics_cassandra_limit_cpu: 3000m
openshift_metrics_cassandra_limit_memory: 3Gi
openshift_metrics_cassandra_node_selector: {“region”:”infra”}
openshift_metrics_cassandra_pvc_prefix: hawkular-metrics
openshift_metrics_cassandra_pvc_size: 40G
openshift_metrics_cassandra_request_cpu: 2000m
openshift_metrics_cassandra_request_memory: 2Gi
openshift_metrics_cassandra_storage_type: pv
openshift_metrics_cassandra_pvc_storage_class_name: ceph-storage
openshift_metrics_cassanda_pvc_storage_class_name: ceph-storage
openshift_metrics_image_version: v3.9
openshift_metrics_install_metrics: True
openshift_metrics_duration: 14
openshift_metrics_hawkular_limits_cpu: 3000m
openshift_metrics_hawkular_limits_memory: 3Gi
openshift_metrics_hawkular_node_selector: {“region”:”infra”}
openshift_metrics_hawkular_requests_cpu: 2000m
openshift_metrics_hawkular_requests_memory: 2Gi
openshift_metrics_heapster_limits_cpu: 3000m
openshift_metrics_heapster_limits_memory: 3Gi
openshift_metrics_heapster_node_selector: {“region”:”infra”}
openshift_metrics_heapster_requests_cpu: 2000m
openshift_metrics_heapster_requests_memory: 2Gi
Note that we are defining both openshift_metrics_cassandra_pvc_storage_class_name and openshit_metrics_cassanda_pvc_storage_class_name due to a typo that was recently fixed, yet not in OpenShift Origin last packages.
Setting up those metrics may allow you to create Nagios commands based on querying for resources allocations and consumptions, using:
$ oc adm top node –heapster-namespacce=openshift-infra –heapster-scheme=https node.example.com
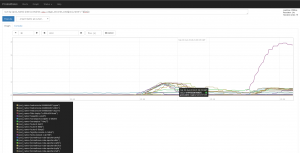
Another solution that integrates well with OpenShift is Prometheus, that could be deployed using the playbooks/openshift-prometheus/config.yml playbook and those Ansible variables:
openshift_prometheus_alertbuffer_pvc_size: 20Gi
openshift_prometheus_alertbuffer_storage_class: ceph-storage
openshift_prometheus_alertbuffer_storage_type: pvc
openshift_prometheus_alertmanager_pvc_size: 20Gi
openshift_prometheus_alertmanager_storage_class: ceph-storage
openshift_prometheus_alertmanager_storage_type: pvc
openshift_prometheus_namespace: openshift-metrics
openshift_prometheus_node_selector: {“region”:”infra”}
openshift_prometheus_pvc_size: 20Gi
openshift_prometheus_state: present
openshift_prometheus_storage_class: ceph-storage
openshift_prometheus_storage_type: pvc
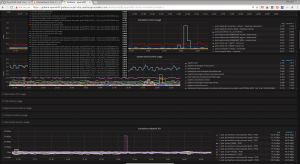
We could also deploy some Grafana, that could include a pre-configured dashboard, rendering some Prometheus metrics – thanks to the playbooks/openshift-grafana/config.yml playbook and the following Ansible variables:
openshift_grafana_datasource_name: prometheus
openshift_grafana_graph_granularity: 2m
openshift_grafana_namespace: openshift-grafana
openshift_grafana_node_exporter: True
openshift_grafana_node_selector: {“region”:”infra”}
openshift_grafana_prometheus_namespace: openshift-metrics
openshift_grafana_prometheus_serviceaccount: prometheus
openshift_grafana_storage_class: ceph-storage
openshift_grafana_storage_type: pvc
openshift_grafana_storage_volume_size: 15Gi
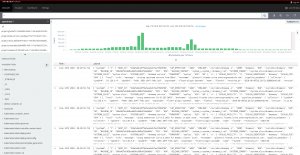
And finally, we could also deploy logs centralization with the playbooks/openshift-logging/config.yml playbook, setting the following:
openshift_logging_install_logging: True
openshift_logging_curator_default_days: ‘7’
openshift_logging_curator_cpu_request: 100m
openshift_logging_curator_memory_limit: 256Mi
openshift_logging_curator_nodeselector: {“region”:”infra”}
openshift_logging_elasticsearch_storage_type: pvc
openshift_logging_es_cluster_size: ‘1’
openshift_logging_es_cpu_request: ‘1’
openshift_logging_es_memory_limit: 8Gi
openshift_logging_es_pvc_storage_class_name: ceph-storage
openshift_logging_es_pvc_dynamic: True
openshift_logging_es_pvc_size: 25Gi
openshift_logging_es_recover_after_time: 10m
openshift_logging_es_nodeslector: {“region”:”infra”}
openshift_logging_es_number_of_shards: ‘1’
openshift_logging_es_number_of_replicas: ‘0’
openshift_logging_fluentd_buffer_queue_limit: 1024
openshift_logging_fluentd_buffer_size_limit: 1m
openshift_logging_fluentd_cpu_request: 100m
openshift_logging_fluentd_file_buffer_limit: 256Mi
openshift_logging_fluentd_memory_limit: 512Mi
openshift_logging_fluentd_nodeselector: {“region”:”infra”}
openshift_logging_fluentd_replica_count: 2
openshift_logging_kibana_cpu_request: 600m
openshift_logging_kibana_hostname: kibana.router.intra.unetresgrossebite.com
openshift_logging_kibana_memory_limit: 736Mi
openshift_logging_kibana_proxy_cpu_request: 200m
openshift_logging_kibana_proxy_memory_limit: 256Mi
openshift_logging_kibana_replica_count: 2
openshift_logging_kibana_nodeselector: {“region”:”infra”}
Meanwhile we could note that cri-o is getting better support in the latter versions of OpenShift, among a never-ending list of ongoing works and upcoming features.


