Menu

Monthly archives "May"

8 Articles

OpenDKIM

OpenDKIM is the reference implementation dealing with DomainKeys Identified Mail (DKIM), maintained by the OpenDKIM Project, licensing under the new BSD License.

DKIM validation aims to prevent email spoofing by checking incoming mail from a remote domain for a DKIM header specifying a signature. The given signature should be validated against a DNS record, held by the remote domain, publishing its public key.
Having your mails properly signed increase your chances to avoid SPAM detection.

DKIM was first defined in RFC 4870, then superseded by RFC 4871, then updated by RFC 5672, and finally by RFC 6376.

Setting OpenDKIM up is a five minutes deal.
The whole setup process is best described by my last puppet module, also dealing with replicating private keys to all your signing SMTPs, and writing your public keys to your DNS and refreshing your zones configuration.

Pakiti

Pakiti is a patching status monitoring tool developed within the CERN, more recently took over by CESNET and an other CERN (Czech Educational and Research Network).

It is quite handy dealing with RHEL and debian-flavored operating systems.
Having tried to add FreeBSD/OpenBSD support, I can tell it is doable, although I haven’t succeeded yet.

pakiti dashboard

pakiti dashboard

Common pakiti setups involve a main server and several clients.
The main server usually has its own MySQL database. Periodically, it would retrieve update digests from configured repositories.
The client side consists on a small script, which main purpose is to list all packages locally installed and corresponding. Finishing its processing, the client connects to its master, send its report and eventually prints a list of outdated packages.

Obviously, the main advantage of this, over the direct alternatives (such as apt and apt_all plugins from munin) is that you don’t have to periodically retrieve latest packages headers from your repositories. The pakiti master does it once, sparing you what could become IO storms (assuming you have a physical host running around 20 VMs, having the apt_all plugins activated on all of them: statistically, you are running apt-get update once per minute).

The dark side of Pakiti, is the lack of official packages, updates, … The fact you need to patch, to have it work with latest PHP versions, …
Don’t expect running Pakiti right after unpacking their archive. Beware of their incomplete documentation. You might prefer to have a look at my puppet module, which prepares almost everything.


(2015/06/08) edit: discussing with Lafouine41 a few weeks ago, I misunderstood pakiti3 was ready to be released. After further investigations, I noticed the client wasn’t even Debian capable.
On a late night, I contributed the following patches:

Collectd

Collectd is yet another popular monitoring solution.

Collectd uses a single modular agent dealing with both metrics collection and re-transmission.

Like Munin, collectd uses RRD.
Unlike Munin, Collectd collects data locally (without connecting to a remote host: the agent generates its own RRD locally). Additionally, You may load a plugin (network) allowing both to forward your metrics to some remote host, and to gather metrics from remote peers.

Like Munin, Collectd comes with a list of common plugins.
Unlike Munin, Collectd plugins, are libraries. Creating one is harder. And mostly pointless, as Collectd provides with plugins allowing you to run a script.

Most recently, Collectd introduced a filter plugin based on iptables, allowing you to match metrics using regular expressions and handle them differently.

Collectd comes with a very basic web interface – collection3. You may try it, then would quickly try the first alternative you could get your hands on. A easy-to-setup collectd frontend being SickMuse, using bootstrap API.

Munin

Munin is a popular supervision solution mostly based on perl.

As of most supervision and monitoring solution, munin relies on an agent you would install on hosts to track metrics from, and a server gathering metrics and serving them via CGI, generating graphics from collected data.
As of most supervision and monitoring solutions, munin uses loadable probes (plugins) to extract metrics.

The server side consists of a crontab. Iterating on all your hosts, it would list and execute all available probes, store the results into RRD.
Over thousand hosts, you may need to export munin working root to some tmpfs storage, adding a crontab to regularly rsync the content from this tmpfs to a persistent directory. In any case, hosting your filesystem on some SSD is relevant.

The main advantage of munin over its alternatives, I think, is its simplicity.
Main concurrent here being Collectd, which default web front end is particularly ugly and unpractical. And alternate front ends such as SickMuse are nice-looking, but still lack from simplicity, while some require excessively redundant configuration before being able to present something comparable to munin, in terms of relevance and efficiency.

It is also very easy, to implement your own probes. From scripts to binaries, with a simple way to set contextual variables – evaluated when the plugin name matches the context expression – and requiring a single declaration on the server to collect all metrics served by a node: I don’t know of any supervision solution easier to deploy. And to incorporate to your orchestration infrastructure.

Finally, debugging probes is conceptually easy: all you need is telnet.

muninone:~# telnet 10.42.242.98 4949
Trying 10.42.242.98...
Connected to 10.42.242.98.
Escape character is '^]'.
# munin node at cronos.adm.intra.unetresgrossebite.com
list
cpu df load memory ntp_kernel_err ntp_kernel_pll_freq ntp_kernel_pll_off open_files processes users vmstat
fetch cpu
user.value 3337308
nice.value 39168
system.value 13389003
interrupt.value 6679408
idle.value 701005749
.
quit
Connection closed by foreign host.
muninone:~#

Here is a bunch of plugins I use, that you won’t find in default installations. Most of them being copied from public repositories such as github.

Let’s introduce the few probes I wrote, starting with pool_. You may use it to wrap any munin probe. Its main advantage being it consists on a single cat, it answers quickly, and prevent you from generating discontinuous graphics.
I used it in conjunction with the esx_ probe (found somewhere / patched, mostly not mine), which may take several seconds to complete. When a probe takes time to answer, munin times out, discarding data. Using a crontab pooling and keeping your metrics to temporary files independently from munin traditional metrics retrieval process, and using the pool_ probe to present these temporary file is a way to deal with these probes, requiring unusual processing time.

Less relevant, the freebox_ probe, for Freebox V5 (inspired by a similar probe, dealing with Freebox V6):

# munin node at cronos.adm.intra.unetresgrossebite.com
fetch freebox_atm
atm_down.value 6261
atm_up.value 1025
.
fetch freebox_attenuation
attenuation_down.value 44.00
attenuation_up.value 24.80
.
fetch freebox_snr
snr_down.value 6.40
snr_up.value 7.20
.
fetch freebox_status
status.value 1
.
fetch freebox_uptime
uptime.value 131.73
.

Multi Router Traffic Grapher

Also known as MRTG, this solution is perfect to generate graphs from SNMP checks.
MRTG would most likely be used to graph bandwidths and throughput: running their configuration generation utility (cfgmaker) without options would output everything related to your SNMP target network interfaces. Although, MRTG is virtually able to deal with anything your SNMP target can send back (disks, load, memory, …).

MRTG is very modular. Metrics may be stored in several formats, and viewed by several interfaces.
Shipped with its own html indexes generators, MRTG main task is to collect SNMP data.

Default web user interface is more of test page, than an actual supervision solution front page.
From there, several solutions came up, others grew, aiming to wrap MRTG greatness on some more-or-less powerful interfaces.
14all.cgi is one of the more popular frontend to MRTG, providing with a very simple, yet powerful, interface to your metrics.
router2.cgi looks more exhaustive on paper – I still haven’t tested it yet.
Solutions such as Cacti as well, may also use MRTG.

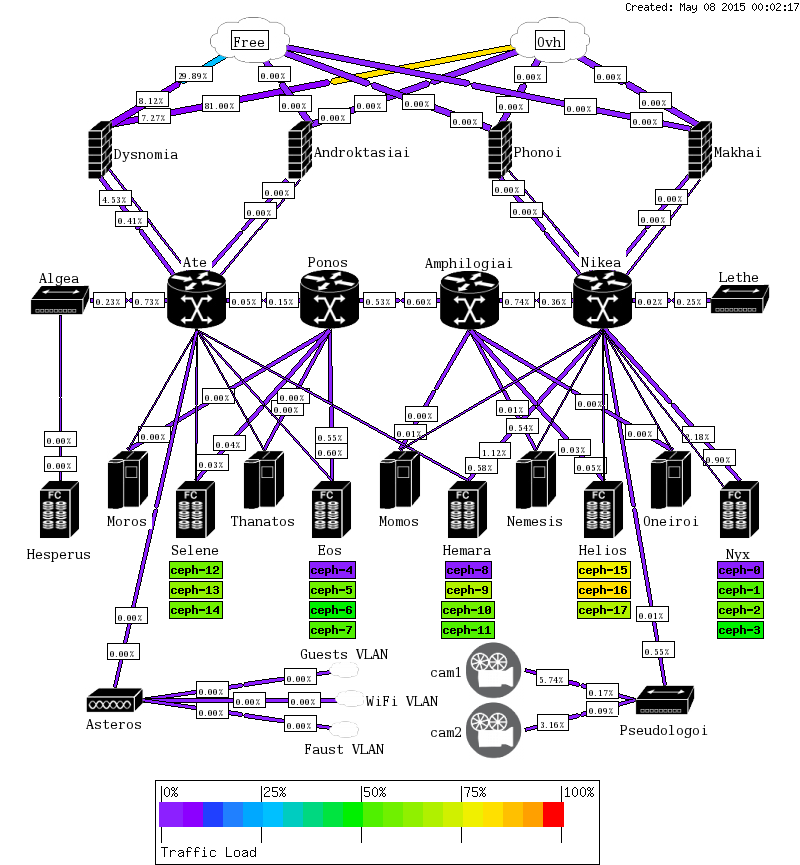
An other popular solution to use over MRTG, is PHP-Weathermap (not to confuse with Weathermap4rrds, their configuration syntax being almost identic, the latter lacks a few features over the original).
Derivatives may be found on OVH own network weathermap (by the way, my congratulations to the intern that most likely spend several days, configuring this map). You’ve got the idea: placing and connecting your objects, associating your rrdtool collections to specific links.

So far, I’ve mostly used 14all.cgi, which is awesome dealing with graphs – generating graphs by clicking specific points on an image is not possible, using generic MRTG interface.
Although, I’m still not convinced by the overall presentation of these graphs. While working for Smile, my manager was nagging me about this. I ended up writing my own client, re-using munin CSS and 14all.cgi graphs. Then, adding weathermap support. And finally, keeping a copy of generated maps to provide with an history presented to web clients.

ceph-dash

Having recently finished to re-install my cloud environments, I am now focusing on setting back up my supervision and monitoring services.

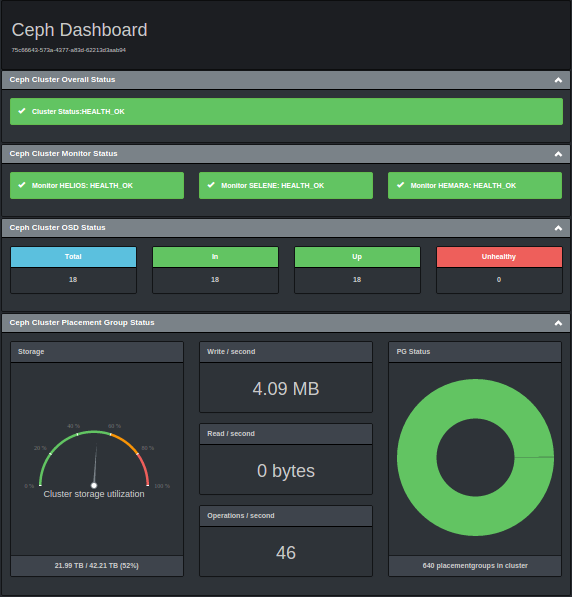
Last week, a friend of mine (Pierre-Edouard Gosseaume) told me about his experience with ceph-dash, a dashboard for Ceph I hadn’t heard from back then.
Like most ceph users, I’ve heard of Calamari. A languages, frameworks and technologies orgie I’ve ended up building by myself, and deploying on a test cluster I used to operate in Smile.
Calamari is sort of a fiasco. The whole stack gets fucked up by the underlying component: Saltstack.
Saltstack is yet another configuration deployment solution such as Puppet, Ansible or Rundeck.
Using Calamari, the calamari-server instance would use saltstack to communicate with its clients. As far as I could see, saltstack service randomly stops running on clients, until no one is responding to our server queries. A minute-based cron is required to keep your queries somewhat consistent. It’s a mess, I’ve never installed calamari on a prod cluster, and would recommend waiting at least for some pre-packaged release.

So, back to ceph-dash.
My first impression was mitiged, at best. Being distributed on github, by some “Crapworks“, I had my doubts.
On second thoughts, you can see they have a domain, crapworks.de. Deutsche kalität, maybe germans grant some hidden meaning to the crap thing, allright.

Again, there’s no package shipped. And as of Calamari, ceph-dash makefile allows you to build deb packages.
Unlike Calamari, ceph-dash is a very lightweight tool, based mostly on python, inducing low overhead, and able to run fully deported of your ceph cluster.
Even if the documentation tells you to install ceph-dash onto a MON host of your cluster, you may as well install it to some dedicated VM, as long as you do have installed the right librados, have a correct /etc/ceph/ceph.conf, and can use a valid keyring accessing the cluster.

ceph-dash ships with a small script running your service for tests purposes. It also ships with the necessary configuration for Apache integration, easily convertible to Nginx.
The zero-to-dashbord is done in about 5 minutes. Which again, is vastly different from my experience with Calamari.
The major novelty being, it actually works.

Subsonic

An other day, an other service to deploy, an other chance to see Jessie in action.
I’ve been using subsonic for a couple years now, and am quite satisfied by the product.

The practical bad side of Subsonic is that is relies on Java.
Meanwhile, there isn’t a lot of alternatives dynamically serving media behind an HTTP server. The solution everyone talk about is Ampache – for those who haven’t dealt with it yet, the web user interface looks disappointingly outdated. So much so, Subsonic is actually the only frontend I would recommend, serving music libraries.

Dealing with ever-growing libraries, regular clients such as Clementine, Amarok, Banshee, … are eating all my desktop RAM, when they don’t fuck with my IO scanning libraries directory trees, …
At some point, java resources consumption is actually lower than any graphical client. Plus, being available through HTTP, your database management could be deported to some virtual environment, while the player could be handled by any flash-capable web client, or a wide range of applications implementing subsonic client API.

An other inconvenient about subsonic is that a few features are locked, until you end up paying for your license.
A few years ago, one was able to buy a permanent license: investing something like 10$, a friend (Paul) activated its subsonic and never had to pay again.
Last year, license plans changed. During a few months, the lifetime license disappeared. Came back, as far as I can see today, and now costs 99$.

Why pay for Subsonic premium services?
You most likely won’t need most of the features involved. I still don’t.
Although, an other friend (Clement) explained me after one month trying Subsonic on his VPS, he was unable to cache new media on its Android phone, using Subsonic official application.

Why would you pay, then?
You don’t, actually. I can’t find back the thread on Subsonic forums: once upon a time, there was a discussion reporting some info I formerly read on some blog, about the possibility to use the developers test account as yours to enable premium features on your Subsonic instance. Quickly following that post, the main developer answered, telling it won’t be possible anymore.
Today, the only reference to it, on subsonic web site, is actually an error message, inviting you to renew your subscription.
From my point of view, this is more of a communication operation, than an actual fix. Indeed, you would still be able to use the very same login and registration key to enable premium features.

Originally, you only needed to add a few lines to your subsonic.properties:

LicenseEmail=foo@bar.com
LicenseCode=f3ada405ce890b6f8204094deb12d8a8
LicenseDate=1424696437740

Today, you also need to add the following to you /etc/hosts:

127.0.0.1 subsonic.org

Restart subsonic service, enjoy premium.

Concluding on a comment regarding Jessie, you might have notice the ffmpeg package did not make it to Jessie official repositories. Which is no surprise for some aficionados – and definitely was for me.
It seems Debian Security team had no time to deal with ffmpeg. Yet dealt with libav. Integrated systemd. And killed kfreebsd.

Plex

The last few days, I’ve been re-creating my ceph cluster from scratch.
After a first disaster in january, leading to the loss of a placement group (over 640), and most recenty the loss of my only monitor, I decided to start from a clean slate.
After two days importing a few terabytes, the main services are back up, and I took the afternoon to install for the very first time a streaming solution I’ve been hearing good things about: Plex.

As far as I can tell, it works pretty well.
Two things I would complain about, starting with the debian packaging, that assume there is no systemd on debian – ironically, the script handles systemd on ubuntu after 14.04: a test is missing to be fully jessie-compliant.
The second thing may be a PEKAC, I still need to investigate. It appears when I’m streaming more than two media, I get errors about the server not being able to open the source media.

Plex lets you browse your media libraries. Scanning directory trees, matching files for either Movies, TV Shows, Music or Home Movies.
Beforehand, you would need to ensure your libraries are properly named, according to Plex standards. If you prefer keeping your layout intact, you may write some script linking your media to some alternative library root, allowing plex to properly deal with your medias.

Starting with my movies and series the first day, I quickly wrote an other script linking my music medias to a directory according to plex music libraries naming directives.
Checking out all plex menus, I ended up configuring Channels, connecting to my YouTube, Vimeo and SoundCloud accounts.

In the end, Plex is very much more, than I was expecting in the first place.
It’s doing quite well, in everything I have tested right now. The video player easily allows you to switch audio track, subtitle track, media quality. Transcoding may induces relatively huge CPU load. When streaming starts jerking, look at the “settings-like” icon, either pick Original transcoding quality, or just lower your bitrate.

Last comment: note the runtime user of Plex need to have write access to your libraries directory – folders not allowing writes would not be scanned. Even if I’ve found no proof of anything being written there, ATM.

And let’s finish on a script used with some SickBeard backend, rewriting the your episodes metadata (mtime) to match their actual release date.