About a couple months ago, I started working for Peerio. I’ll probably make an other post introducing them better, as the product is pretty exciting, the client has been open sourced, mobile clients will be released soon, code is audited by Cure53…
Point being, since then, I’m dealing with our hosting provider, pretty much auditing their work.
One problem we had was the monitoring setup. After a couple weeks asking, I finally got an explanation as for how they were monitoring service, and why they systematically missed service outages.
Discovering the “monitoring” provided was based on a PING check every 5 minutes, and a SNMP disk check: I reminded our provider that our contract specifically tells about an http check matching a string, and so far we had to do that check ourselves.
After a few days of reflection, our provider contacted us back, proposing to register our instances to datadog and setup monitoring from there.
My first reaction, discovering Datadog, is looks a little bit like graphite, collectd. To some extend, even munin. Although, Datadog meta tags tells about traps, monitoring, … Why not. Still, note that the free version only allows to register 5 hosts.
I’ll skip the part where our provider fails to configure our http check, and end up graphing the response time of our haproxy, regardless of the reponse code (200, 301, 502, nevermind, haproxy answers), while the http check on nginx fails (getting https://localhost/, with the certificate check option set to true). When replacing our production servers, I shut down the haproxy service from our former production instances, to realize datadog was complaining about failing to parse the plugin output before disabling the plugin on the corresponding hosts. Epic.
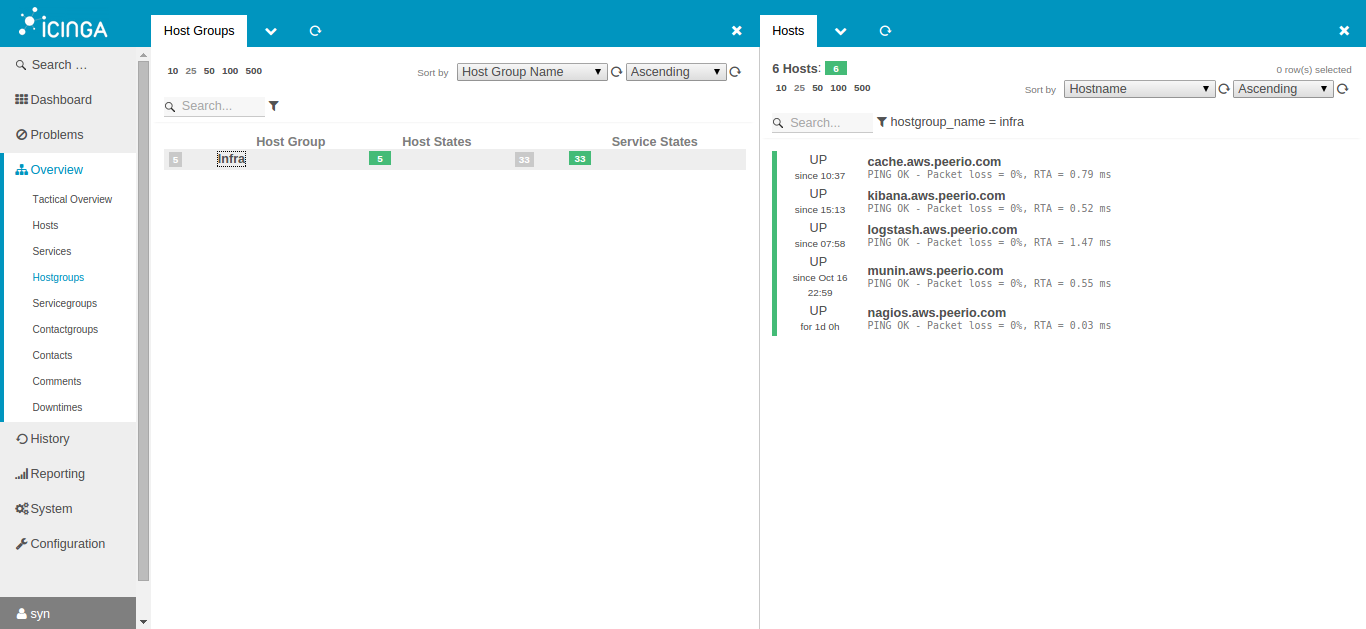
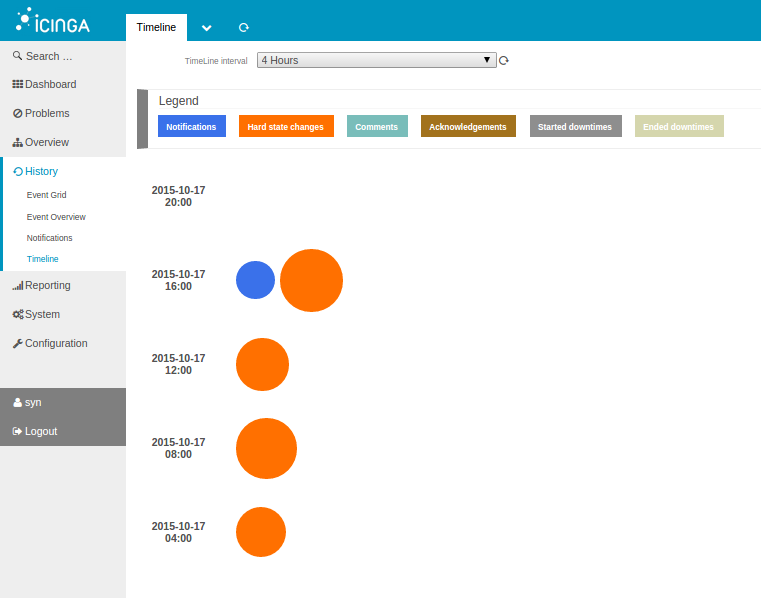
We are just about to get rid of them, for breach of contract. I already have my nagios (icinga2) based monitoring. But I’m still intrigued: a monitoring solution that may effectively distinguish failing instances from nodes being replaced in an AutoScale Group could be pretty interesting, hosting our service on AWS.
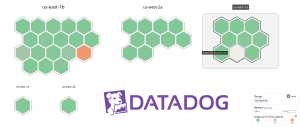
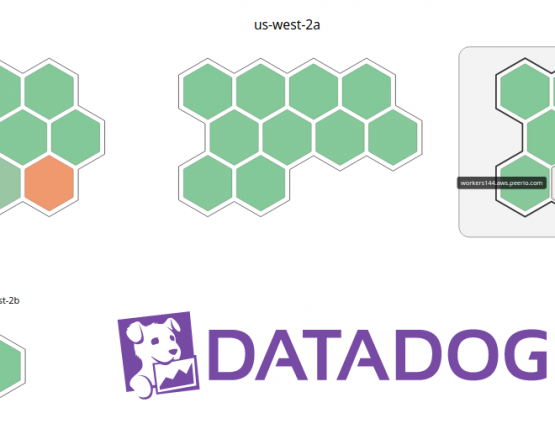
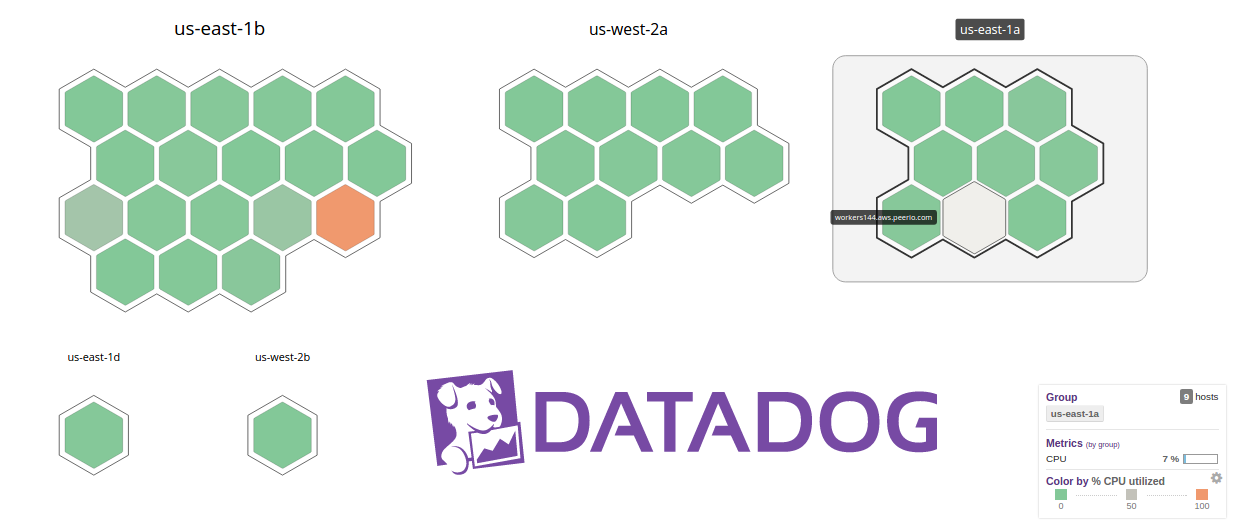
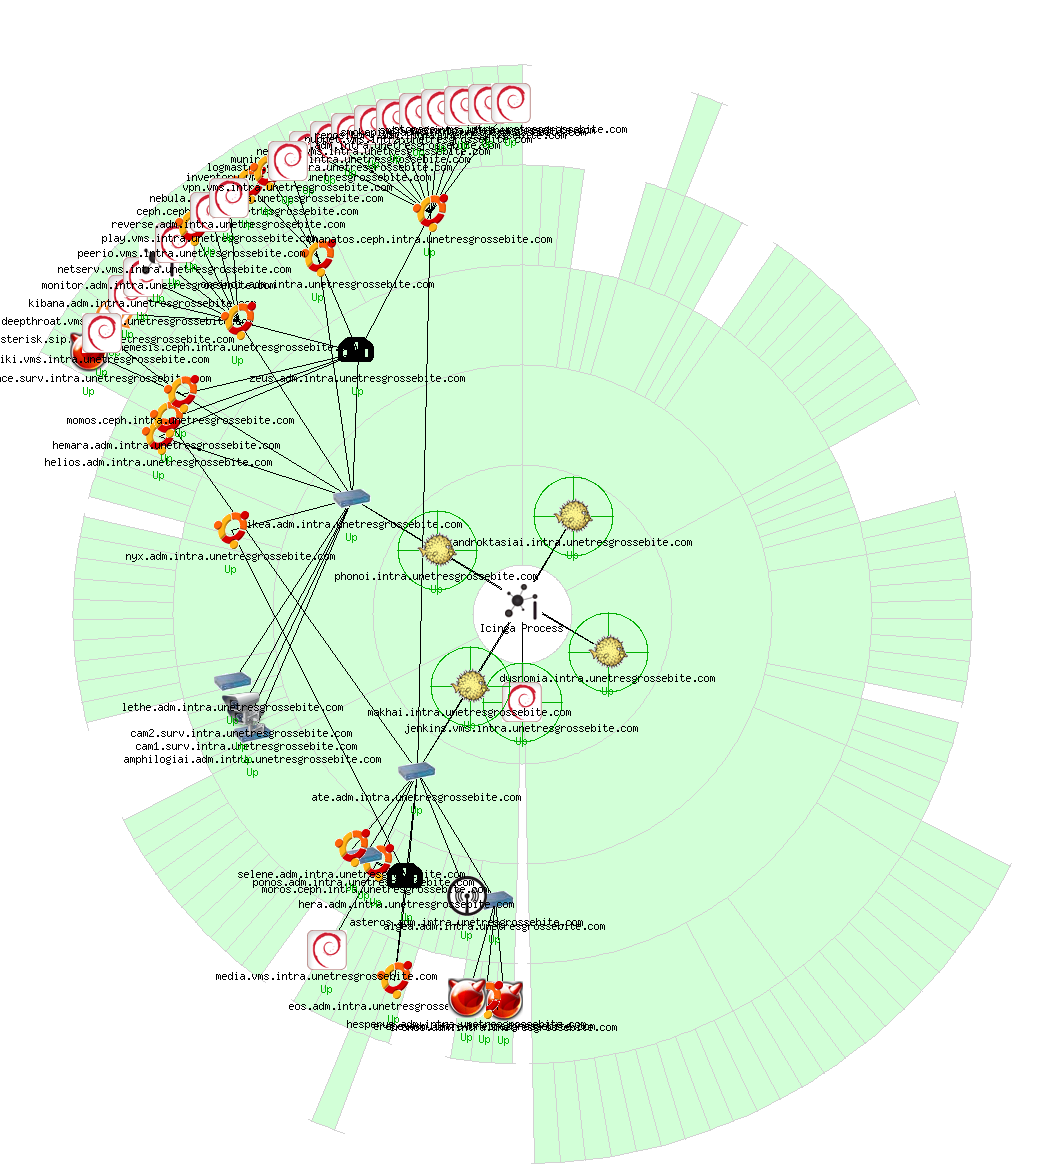
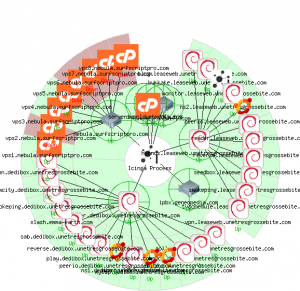
Datadog Infrastructure View
The first thing we could say about Datadog, is that it’s “easy” – and based on python.
Easy to install, easy to use, easy to configure checks, easy to make sense out of data. Pretty nice dashboards, in comparison to collectd or munin. I haven’t looked at their whole list of “integrations” yet (integration: module you enable from your dashboard, provided that your agents forward metrics this plugin may use generating graphs or sending alerts), though the ones activated so far are pretty much what we could hope for.
Let’s review a few of them, starting with the haproxy dashboard:
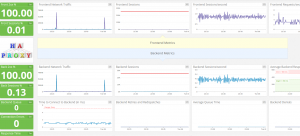
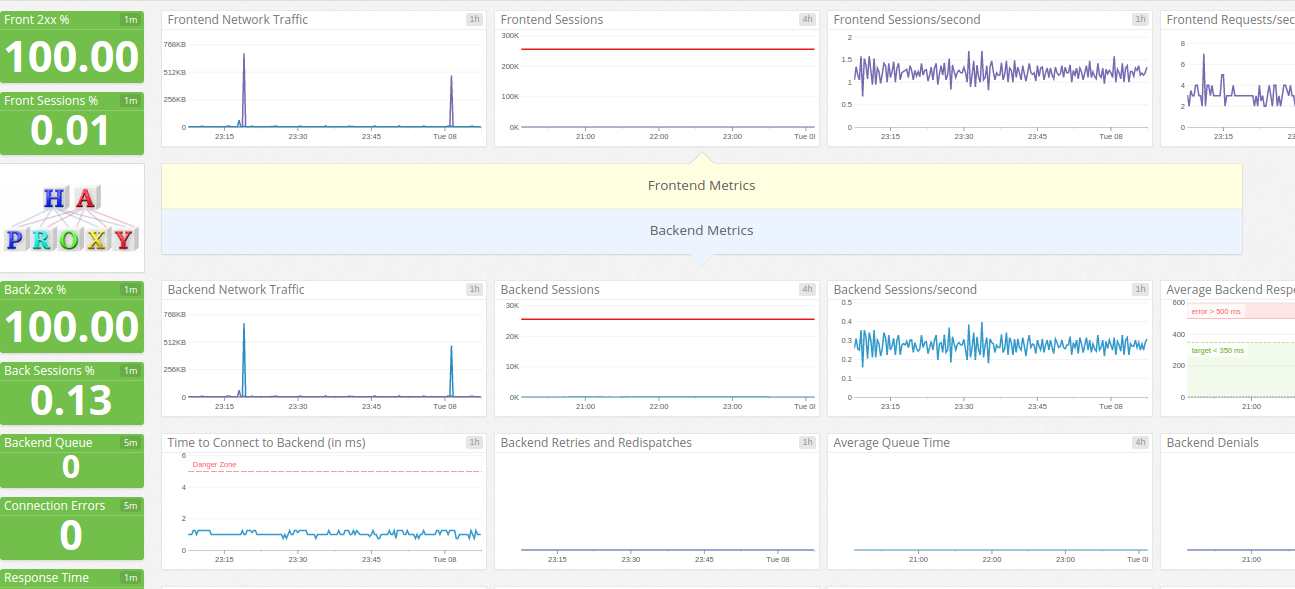
Datadog HAproxy dashboard
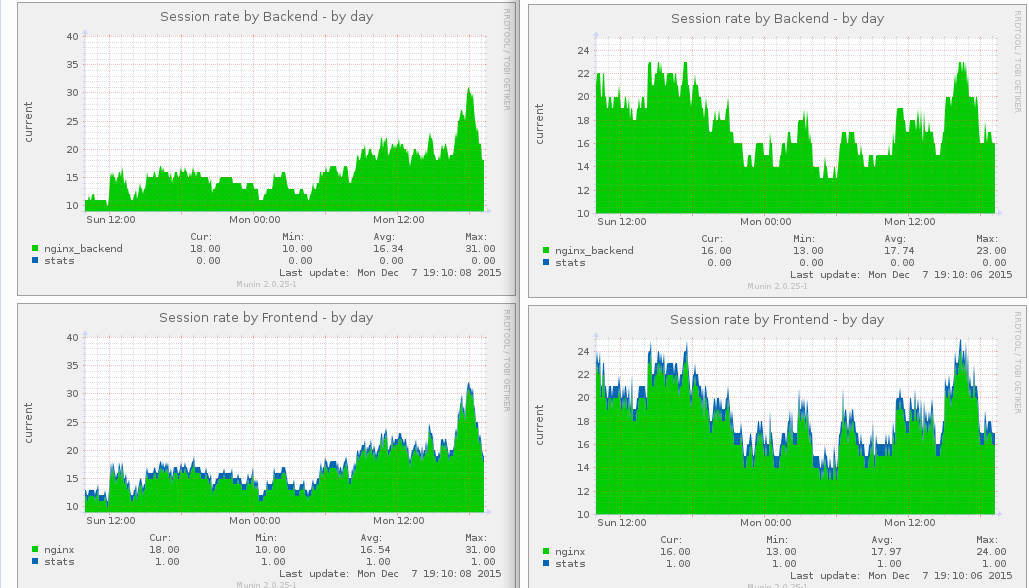
The only thing I’m not sure to understand yet, is how to look up the amount of current sessions, which is something relatively easy to set up using munin:

Munin HAproxy sessions rate
Still, datadog metrics are relevant, the ‘2xx’ div is arguably more interesting than some ‘error rate’ graph. And over all: these dashboards aggregate data for all your setup – unless configured otherwise. More comparable to collectd/graphite on that matter, than munin where I have to use separate tabs.

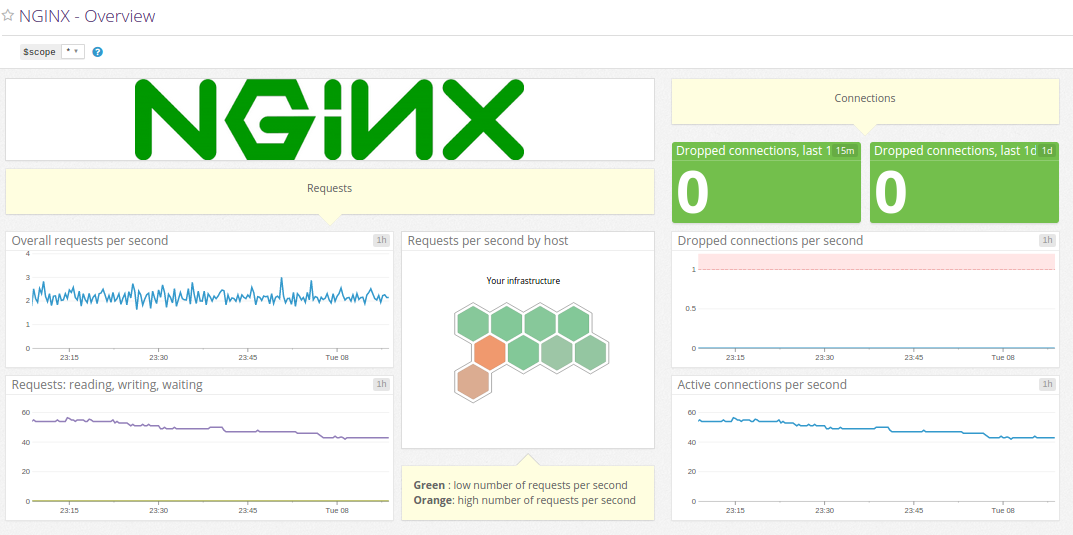
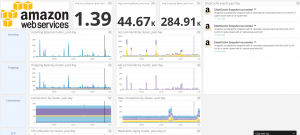
Datadog Nginx dashboard
Datadog Nginx integration comes with two dashboards. We’ll only show one, the other one is less verbose, with pretty much the same data.
Again, I counting dropped connections instead of showing some “all-zeroes” graph is arguably more interesting, and definitely easier to read.
Datadog ElastiCache dashboard
We won’t show them all. In our case, the Riak integration is pretty interesting as well. A few weeks ago, we were still using the Redis integration – since then, we moved to ElastiCache to avoid having to manage our cluster ourselves.
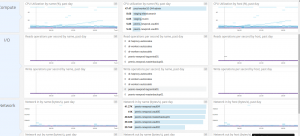
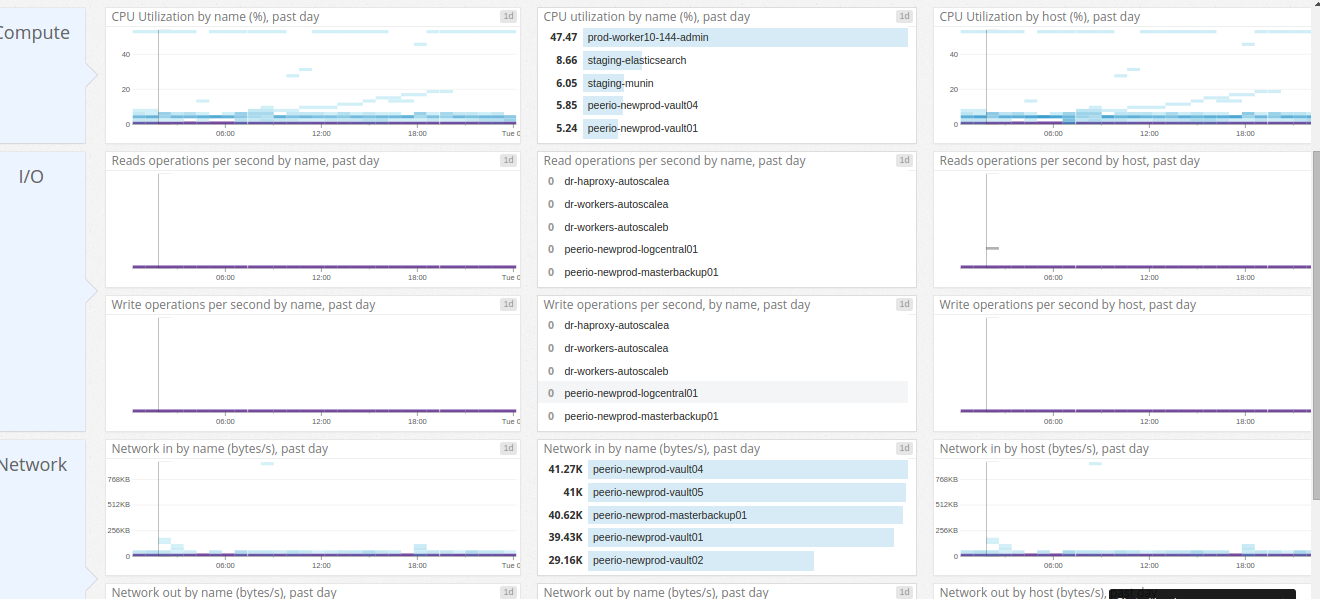
Datadog EC2 dashboard
One of Datadog selling argument is that they are meant to deal with AWS. There’s a bunch of other plugins looking for ELB metrics, DynamoDB, ECS, RDS, … We won’t use most of them, though their EC2 plugin is interesting tracking overall resources usage.
In the end, I still haven’t answered my initial question: can datadog be used to alert us upon service failures. I have now two nagios servers, both sending SMS alerts, I’m not concerned about monitoring any more. Still it might be interesting to give it an other look later.
A downside I haven’t mentioned yet, is that your instances running Datadog agent need to connect to internet. Which may lead you to setting up HTTP proxies, with eventually some ELB or route53 internal records, to avoid adding a SPOF.
Or, as our provider did, attach public IPs to all their instances.
Although this problem might not affect you, as you may not need to install their agent at all. When using AWS, Datadog lists all your resources – depending on ACLs you may set in your IAM role. Installing their agent on your instances, the corresponding AWS metrics would be hidden from Datadog dashboard, superseded by those sent through your agent. Otherwise, you still have some insight on CPU consumption, disk and network usage, …
The main reason you could have to install an agent is to start collecting metrics for haproxy, riak or nginx, something AWS won’t know of.
Datadog is definitely modular. Pretty straight forward integration with AWS. Steep learning curve.
But paying for these is and having no alerts so far, while our hosting provider spent weeks setting it up, no alerts on output plugins failures either: I’m not completely convinced yet.
Still, I can’t argue their product is interesting, and especially relevant to monitoring or supervision neophytes.
Edit: a few days later, leaving our provider, we decided to abandon Datadog as well.
Granted that our former provider was contractually obliged to provide us with a monitoring solution, I was hoping for them to pay the bill – if any. They were the ones supposed to monitor our setup: whatever the solution, as long as they could make it work, I would have been fine with it.
Datadog cheapest paying plan starts at 15$/instance/month. Considering we have about 40 instances, throwing 600$/month for about a hundred graphs made no sense at all. Hosting our own nagios/munin on small instances is indubitably cheaper. Which makes me think the only thing you pay here, is the ease of use.
And at some point, our former provider probably realized this, as they contacted my manager when I started registering our DR setup to Datadog, inquiring on the necessity of looking after these instances.
As of today, we’re still missing everything that could justify the “monitoring” branding of Datadog, despite our provider attending a training on that matter, then spending a couple weeks with nothing much to show for it.
The only metrics munin was not graphing yet have been added to our riak memory probe.