Menu

Results for category "Phail"

5 Articles

KubeVirt

Today we’ll take a quick look at KubeVirt, A Kubernetes native virtualization solution.

While OpenShift and Kubernetes have been all about containers, as of 2018, we’ve started hearing about some weird idea: shipping virtual machines into containers.

Today, KubeVirt is fairly well integrated into OpenShift, which has its own Operator.

If like me, you’re running OpenShift on KVM guests, you’ll first have to make sure nested virtualization was enabled. With an Intel processor, we would look for the following:

$ cat /sys/module/kvm_intel/parameters/nested
Y

Or using AMD:

$ cat /sys/module/kvm_amd/parameters/nested
Y

Unless the above returns with `Y` or `1`, we need to enable nested
virtualization. First, shut down all guests. Then, reload your KVM module:

# modprobe -r kvm_intel
# modprobe kvm_intel nested=1
# cat /sys/module/kvm_intel/parameters/nested
# cat </etc/modprobe.d/kvm.conf
options kvm_intel nested=1
EOF

With AMD, use instead:

# modprobe -r kvm_amd
# modprobe kvm_amd nested=1
# cat /sys/module/kvm_amd/parameters/nested
# cat </etc/modprobe.d/kvm.conf
options kvm_amd nested=1
EOF

Reboot your guests, and confirm you can now find a `/dev/kvm` device:

$ ssh core@compute1.friends
Red Hat Enterprise Linux CoreOS 42.81.20191113.0
...
$ grep vmx /proc/cpuinfo
flags : xxx
...
$ ls /dev/kvm
/dev/kvm

Confirm OpenShift node-capability-detector did discover those devices:

$ oc describe node compute1.xxx
...
Allocatable:
cpu: 7500m
devices.kubevirt.io/kvm: 110
devices.kubevirt.io/tun: 110
devices.kubevirt.io/vhost-net: 110

Now, from the OperatorHub console, we would install the KubeVirt operator. While writing these lines, there are still some bugs, prefer using some lab cluster doing so.

Next, we’ll migrate a test KVM instance, from a regular hypervisor to OpenShift. Here, the first thing we would want to do is to provision a DataVolume.

DataVolumes are built on top of PersistentVolumeClaims, they’re meant to help dealing with persistent volumes, implementing data provisioning.

There’s two ways to go about this: either we can host our disks using a web server, and then we may use the following DataVolume definition:

apiVersion: cdi.kubevirt.io/v1alpha1
kind: DataVolume
metadata:
  name: bluemind-demo
  namespace: wsweet-demo
spec:
  source:
    http:
      url: https://repository.undomaine.com/modeles/kvm/kvm-kubevirt/bm40.qcow2
  pvc:
    accessModes:
    - ReadWriteOnce
    resources:
      requests:
      storage: 20Gi

Or we could use the virtctl client uploading an image from our system into OpenShift:

$ virtctl image-upload dv bluemind-demo --wait-secs=600 --size=8Gi --insecure --block-volume --image-path=/var/lib/libvirt/images/bm40-template.raw
DataVolume wsweet-demo/bluemind-demo created
Waiting for PVC bluemind-demo upload pod to be ready...
Pod now ready
Uploading data to https://cdi-uploadproxy-openshift-operators.apps.undomaine.com
...

The process of uploading a volume would start some temporary Pod, which would use a pair of PVC: one that would receive the final image, the other serving as a temporary storage while upload is running.

Once our image was uploaded, we would be able to create a VirtualMachine object:

apiVersion: kubevirt.io/v1alpha3
kind: VirtualMachine
metadata:
  name: bluemind-demo
  namespace: wsweet-demo
spec:
  running: false
  template:
    metadata:
      labels:
        name: bluemind-demo
    spec:
      domain:
        devices:
          disks:
          - disk:
            bus: virtio
          name: rootfs
          interfaces:
          - name: default
            masquerade: {}
          resources:
            requests:
              memory: 8Gi
              cpu: "1"
      networks:
      - name: default
        pod: {}
terminationGracePeriodSeconds: 600
      volumes:
      - dataVolume:
          name: bluemind-demo
        name: rootfs

$ oc get vm
...
bluemind-demo 2s false
$ virtctl start bluemind-demo
$ oc describe vm bluemind-demo
...
$ oc get vmi
...
bluemind-demo 3s Scheduling
$ oc get pods
...
virt-launcher-bluemind-demo-8kcxz 0/1 ContainerCreating 0 38s

Once that Pod is running, we should be able to attach our guest VNC console:

$ virtctl vnc bluemind-demo

Finish up configuring your system, you may have to rename your network
interfaces, reset IP addresses, fix DNS resolution integrating with OpenShift. Here, we could use cloud-init, or script our own contextualization, installing OpenShift Service CA, …
Datadog

About a couple months ago, I started working for Peerio. I’ll probably make an other post introducing them better, as the product is pretty exciting, the client has been open sourced, mobile clients will be released soon, code is audited by Cure53
Point being, since then, I’m dealing with our hosting provider, pretty much auditing their work.

One problem we had was the monitoring setup. After a couple weeks asking, I finally got an explanation as for how they were monitoring service, and why they systematically missed service outages.
Discovering the “monitoring” provided was based on a PING check every 5 minutes, and a SNMP disk check: I reminded our provider that our contract specifically tells about an http check matching a string, and so far we had to do that check ourselves.

After a few days of reflection, our provider contacted us back, proposing to register our instances to datadog and setup monitoring from there.
My first reaction, discovering Datadog, is looks a little bit like graphite, collectd. To some extend, even munin. Although, Datadog meta tags tells about traps, monitoring, … Why not. Still, note that the free version only allows to register 5 hosts.

I’ll skip the part where our provider fails to configure our http check, and end up graphing the response time of our haproxy, regardless of the reponse code (200, 301, 502, nevermind, haproxy answers), while the http check on nginx fails (getting https://localhost/, with the certificate check option set to true). When replacing our production servers, I shut down the haproxy service from our former production instances, to realize datadog was complaining about failing to parse the plugin output before disabling the plugin on the corresponding hosts. Epic.
We are just about to get rid of them, for breach of contract. I already have my nagios (icinga2) based monitoring. But I’m still intrigued: a monitoring solution that may effectively distinguish failing instances from nodes being replaced in an AutoScale Group could be pretty interesting, hosting our service on AWS.

Datadog Infrastructure View

Datadog Infrastructure View

The first thing we could say about Datadog, is that it’s “easy” – and based on python.
Easy to install, easy to use, easy to configure checks, easy to make sense out of data. Pretty nice dashboards, in comparison to collectd or munin. I haven’t looked at their whole list of “integrations” yet (integration: module you enable from your dashboard, provided that your agents forward metrics this plugin may use generating graphs or sending alerts), though the ones activated so far are pretty much what we could hope for.

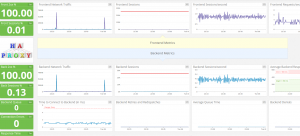
Let’s review a few of them, starting with the haproxy dashboard:

Datadog HAproxy dashboard

Datadog HAproxy dashboard

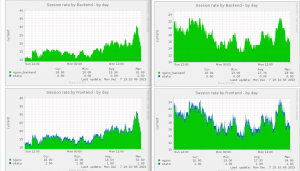
The only thing I’m not sure to understand yet, is how to look up the amount of current sessions, which is something relatively easy to set up using munin:

Munin haproxy sessions rate

Munin HAproxy sessions rate


Still, datadog metrics are relevant, the ‘2xx’ div is arguably more interesting than  some ‘error rate’ graph. And over all: these dashboards aggregate data for all your setup – unless configured otherwise. More comparable to collectd/graphite on that matter, than munin where I have to use separate tabs.

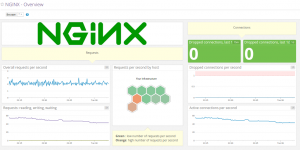
Datadog Nginx dashboard

Datadog Nginx dashboard

Datadog Nginx integration comes with two dashboards. We’ll only show one, the other one is less verbose, with pretty much the same data.

Again, I counting dropped connections instead of showing some “all-zeroes” graph is arguably more interesting, and definitely easier to read.

Datadog ElastiCache dashboard

Datadog ElastiCache dashboard

We won’t show them all. In our case, the Riak integration is pretty interesting as well. A few weeks ago, we were still using the Redis integration – since then, we moved to ElastiCache to avoid having to manage our cluster ourselves.

Datadog EC2 dashboard

Datadog EC2 dashboard

One of Datadog selling argument is that they are meant to deal with AWS. There’s a bunch of other plugins looking for ELB metrics, DynamoDB, ECS, RDS, … We won’t use most of them, though their EC2 plugin is interesting tracking overall resources usage.

In the end, I still haven’t answered my initial question: can datadog be used to alert us upon service failures. I have now two nagios servers, both sending SMS alerts, I’m not concerned about monitoring any more. Still it might be interesting to give it an other look later.

A downside I haven’t mentioned yet, is that your instances running Datadog agent need to connect to internet. Which may lead you to setting up HTTP proxies, with eventually some ELB or route53 internal records, to avoid adding a SPOF.
Or, as our provider did, attach public IPs to all their instances.

Although this problem might not affect you, as you may not need to install their agent at all. When using AWS, Datadog lists all your resources – depending on ACLs you may set in your IAM role. Installing their agent on your instances, the corresponding AWS metrics would be hidden from Datadog dashboard, superseded by those sent through your agent. Otherwise, you still have some insight on CPU consumption, disk and network usage, …
The main reason you could have to install an agent is to start collecting metrics for haproxy, riak or nginx, something AWS won’t know of.

Datadog is definitely modular. Pretty straight forward integration with AWS. Steep learning curve.
But paying for these is and having no alerts so far, while our hosting provider spent weeks setting it up, no alerts on output plugins failures either: I’m not completely convinced yet.
Still, I can’t argue their product is interesting, and especially relevant to monitoring or supervision neophytes.


Edit: a few days later, leaving our provider, we decided to abandon Datadog as well.

Granted that our former provider was contractually obliged to provide us with a monitoring solution, I was hoping for them to pay the bill – if any. They were the ones supposed to monitor our setup: whatever the solution, as long as they could make it work, I would have been fine with it.

Datadog cheapest paying plan starts at 15$/instance/month. Considering we have about 40 instances, throwing 600$/month for about a hundred graphs made no sense at all. Hosting our own nagios/munin on small instances is indubitably cheaper. Which makes me think the only thing you pay here, is the ease of use.
And at some point, our former provider probably realized this, as they contacted my manager when I started registering our DR setup to Datadog, inquiring on the necessity of looking after these instances.

As of today, we’re still missing everything that could justify the “monitoring” branding of Datadog, despite our provider attending a training on that matter, then spending a couple weeks with nothing much to show for it.
The only metrics munin was not graphing yet have been added to our riak memory probe.

Don’t trust the Tahr

Beware that since latest Ubuntu kernel upgrades (14.04.02), you may lose network rebooting your servers!

I’ve had the problem four days ago, rebooting one of my OpenNebula hosts. Still unreachable after 5 minutes, I logged in physically, to see all my “p1pX” and “p4pX” interfaces had disappeared.
Checking udev rules, there is now a file fixing interfaces mapping. On a server I have not rebooted yet, this file doesn’t exist.

The story could have ended here. But with Ubuntu, updates is a daily struggle: today, one of my ceph OSD (hosting 4 disks) spontaneously stopped working.
Meaning: the host was still there, I was able to open a shell using SSH. Checking processes, all ceph osd deamon were stopped. Starting them showed no error, while processes were still absent. Checking dmesg, I had several lines of SSL-related segfaults.
As expected, rebooting fixed everything, from ceph, to my network interfaces names.
It’s in these days I most enjoy freelancing: I can address my system and network outages in time, way before it’s too late.

While I was starting to accept Ubuntu as safe enough to run production services, renaming interfaces on a production system is unacceptable. I’m curious to know how Canonical dealt with that providing BootStack and OpenStack-based services.

Note there is still a way to prevent your interfaces from being renamed:

# ln -s /dev/null /etc/udev/rules.d/75-persistent-net-generator.rules

Jessie, out

Yesterday, Debian announced the release of Jessie as their new stable release, after 24 months of development and patches

First and foremost, Jessie comes with systemd – sysvinit being still available.
Let’s review the fundamentals, before unleashing the troll:

  • Kernel 3.16
  • LibVirt 1.2.9
  • Xen 4.4
  • Vzctl 4.8
  • Asterisk 11.13
  • Puppet 3.7
  • Apache 2.4.10
  • Bind 9.9
  • GCC 4.9
  • PHP 5.6
  • PostgreSQL 9.4
  • MySQL 5.5.43
  • Samba 4.1

Now let’s go back on Systemd, and to Lennard Poettering “gifts” to the community, in general.

Systemd is controversial for many reasons. At first, it was about re-inventing the wheel.
Systemd is supposed to replace sysvinit scripts – powering most of your Unix distributions since 20 years or so.
Although, systemd relies on Linux Kernel specifics, and thus is not portable to BSD. On that subject, Poettering tells us even if his solution would be portable, BSD users won’t switch to it, so there’s no problem in creating a sysvinit alternative targeted to Linux systems (which feels like it could be true, but also sounds like racism), and anyway, porting it would require time investigating on alternatives (see #13 and #15 fom Lennard response to its detractors).
The thing is, systemd does not only replace sysvinit, but also manage file system mounting, power and devices management, disk encryption, network configuration, sessions management, GPT partitions discovery, … Some may argue that Systemd goes against Unix philosophy of “doing one little thing, and do it well”.

From the practical point of view, systemd stores its logs using journald, and binary files. Logs are thus corruptible, and can’t be manipulated as easily as traditional plain-text files.
Being dependend on Linux kernel, using a perticular version of systemd implies running a compatible version of Linux kernel.
Systemd differs from sysvinit by being non-deterministic, non-predictible. Its process is hidden within init, risking to bring down the whole system by crashing. Meanwhile, a plenty of non-kernel system upgrades would now require you to restart your system anyway – tastes like Windows, feels like Windows, …

So why trying to fix something that is working? Why main distributions all seems to switch to systemd, when there is other replacement such as openRC, or even sysvinit?

By nature, integrating and re-designing Unix core components such as udev or dbus unilaterally involve both having all components systematically installed (when a server does not automatically need them), as well as their interface being progressively and obscurely rewritten, providing new interfaces. At some point, GNOME started using logind from systemd, to authenticate users. Setting up GNOME without systemd became acrobatic. More and more distributions are forced to integrate systemd.

Systemd could be described as a system daemon, sometimes referred as a “basic userspace building block to make an OS from”, engulfing features formerly attributed to a syslog daemon, your network or device managers, … Systemd’s spread is symbolic, showing a radical shift in thinking within the Linux community: desktop-oriented, choice-limiting, isolationist. Collateral victim being Debian/kFreeBSD, guilty of not using the holy Linux kernel.

Finishing on a parenthesis regarding kFreeBSD architecture of Debian: despite being encouraged to build it by myself, I’m a bit puzzled.
On one hand, you have the installation-guide-kfreebsd-amd64 package, containing a few HTML files with the well-known documentation, broken links to non-existing kernel and initrds. On the other hand, the kfreebsd-source-10.1 package, which Makefile doesn’t seem to work at all. Hooray for Poettering.

eCryptfs

You may be familiar with eCryptfs, a disk encryption software, especially known for being shipped with Ubuntu default installations, being the ‘Encrypted Home’ underlying solution.

From what I gathered of empirical experiences, I would say eCryptfs, AKA Enterprise Cryptographic Filesystem, should be avoided in both enterprise and personal use cases.

My first surprise was while crawling a site for its record: creating a file per author, I ended up with more than 5000 files in a single directory. At which point, your dmesg should show something like several ‘Valid eCryptfs header not found in file header region or xattr region, inode XXX‘, then a fiew ‘Watchdog[..]: segfault at 0 ip $addr1 sp $addr2 error 6 in libcontent.so[$addr3]

The second surprise, a few days later, while recovering rbd from my ceph cluster. Storing all parts from a disk into a same directory, again, I ended up with folders holding several thousands of file, and my dmesg going mad.
You would notice moving your folder outside of your ecryptfs directory will fix the problem.

Of course, most users won’t recover their ceph nor crawl a site for its complete database. Although, configuring Thunderbird/IceDove, you may end up caching enough mails from your imap/pop server to reach the limits I did.

This is not my first experience with cryptographic solutions.
Once upon a time, TrueCrypt was offering a very exhaustive toolkit, managing from devices to files – so much so, my end-of-studies project was bout forking TrueCrypt, adding features the maintainer did not wanted to see in its product (BootTruster).
On today’s Linux systems, a more classic way to do it would be to use Luks (Linux Unified Key Setup), based on a standardized device-mapper: dm-crypt.

Anyway: next time you’re asked about encrypting your home file system, think twice about what solution you’re going to use. Then, chose Luks.