Menu

Results for category "Supervision"

23 Articles

OpenShift Supervision

Today I am looking back on a few topics I had a hard time properly deploying using OpenShift 3.7 and missing proper dynamic provisioning despite a poorly-configured GlusterFS cluster.
Since then, I deployed a 3 nodes Ceph cluster, using Sebastien Han’s ceph-ansible playbooks, allowing me to further experiment with persistent volumes.
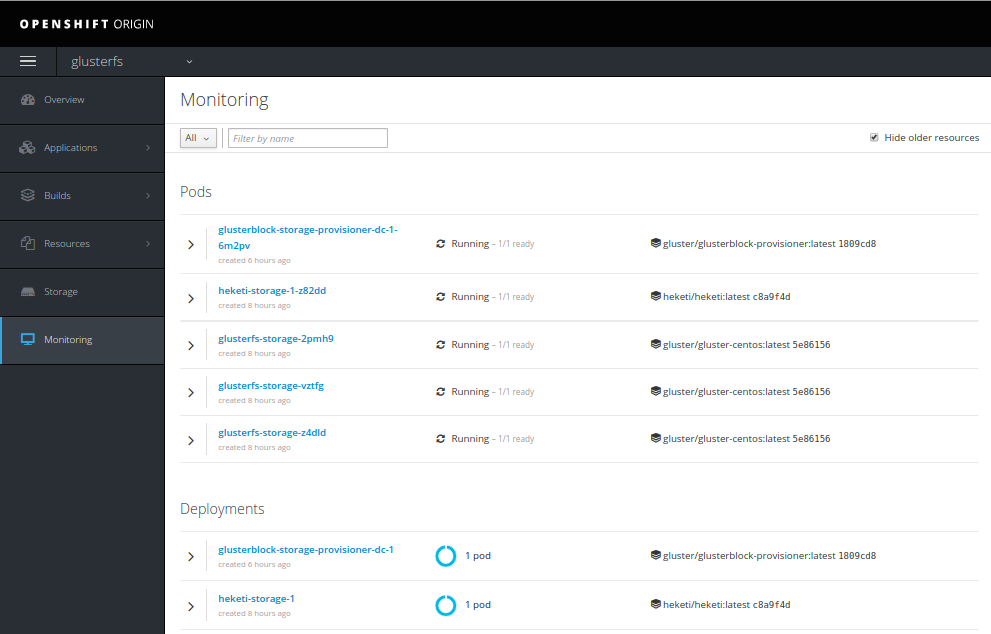
And OpenShift Origin 3.9 also came out, shipping with various fixes and new features, such Gluster Block volumes support, that might address some of GlusterFS performances issues.


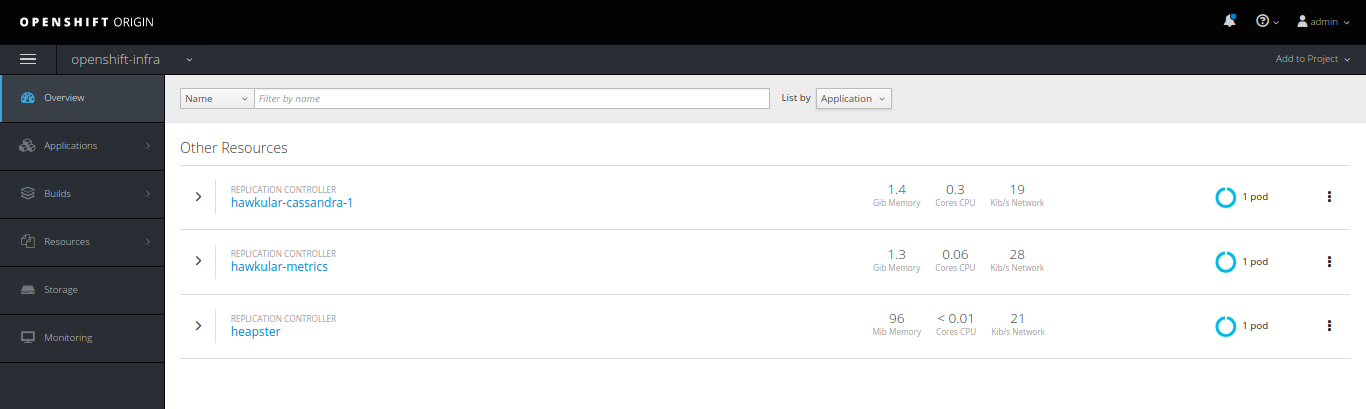
OpenShift Ansible playbooks include a set of roles focused on collecting and making sense out of your cluster metrics, starting with Hawkular.

We could set up a few Pods running Hawkular, Heapster to collect data from your OpenShift nodes and a Cassandra database to store them, defining the following variables and applying the playbooks/openshift-metrics/config.yml playbook:

Hawkular

Hawkular integration with OpenShift

openshift_metrics_cassandra_limit_cpu: 3000m
openshift_metrics_cassandra_limit_memory: 3Gi
openshift_metrics_cassandra_node_selector: {“region”:”infra”}
openshift_metrics_cassandra_pvc_prefix: hawkular-metrics
openshift_metrics_cassandra_pvc_size: 40G
openshift_metrics_cassandra_request_cpu: 2000m
openshift_metrics_cassandra_request_memory: 2Gi
openshift_metrics_cassandra_storage_type: pv
openshift_metrics_cassandra_pvc_storage_class_name: ceph-storage
openshift_metrics_cassanda_pvc_storage_class_name: ceph-storage

openshift_metrics_image_version: v3.9
openshift_metrics_install_metrics: True
openshift_metrics_duration: 14
openshift_metrics_hawkular_limits_cpu: 3000m
openshift_metrics_hawkular_limits_memory: 3Gi
openshift_metrics_hawkular_node_selector: {“region”:”infra”}
openshift_metrics_hawkular_requests_cpu: 2000m
openshift_metrics_hawkular_requests_memory: 2Gi
openshift_metrics_heapster_limits_cpu: 3000m
openshift_metrics_heapster_limits_memory: 3Gi
openshift_metrics_heapster_node_selector: {“region”:”infra”}
openshift_metrics_heapster_requests_cpu: 2000m
openshift_metrics_heapster_requests_memory: 2Gi

Note that we are defining both openshift_metrics_cassandra_pvc_storage_class_name and openshit_metrics_cassanda_pvc_storage_class_name due to a typo that was recently fixed, yet not in OpenShift Origin last packages.

Setting up those metrics may allow you to create Nagios commands based on querying for resources allocations and consumptions, using:

$ oc adm top node –heapster-namespacce=openshift-infra –heapster-scheme=https node.example.com


Another solution that integrates well with OpenShift is Prometheus, that could be deployed using the playbooks/openshift-prometheus/config.yml playbook and those Ansible variables:

Prometheus

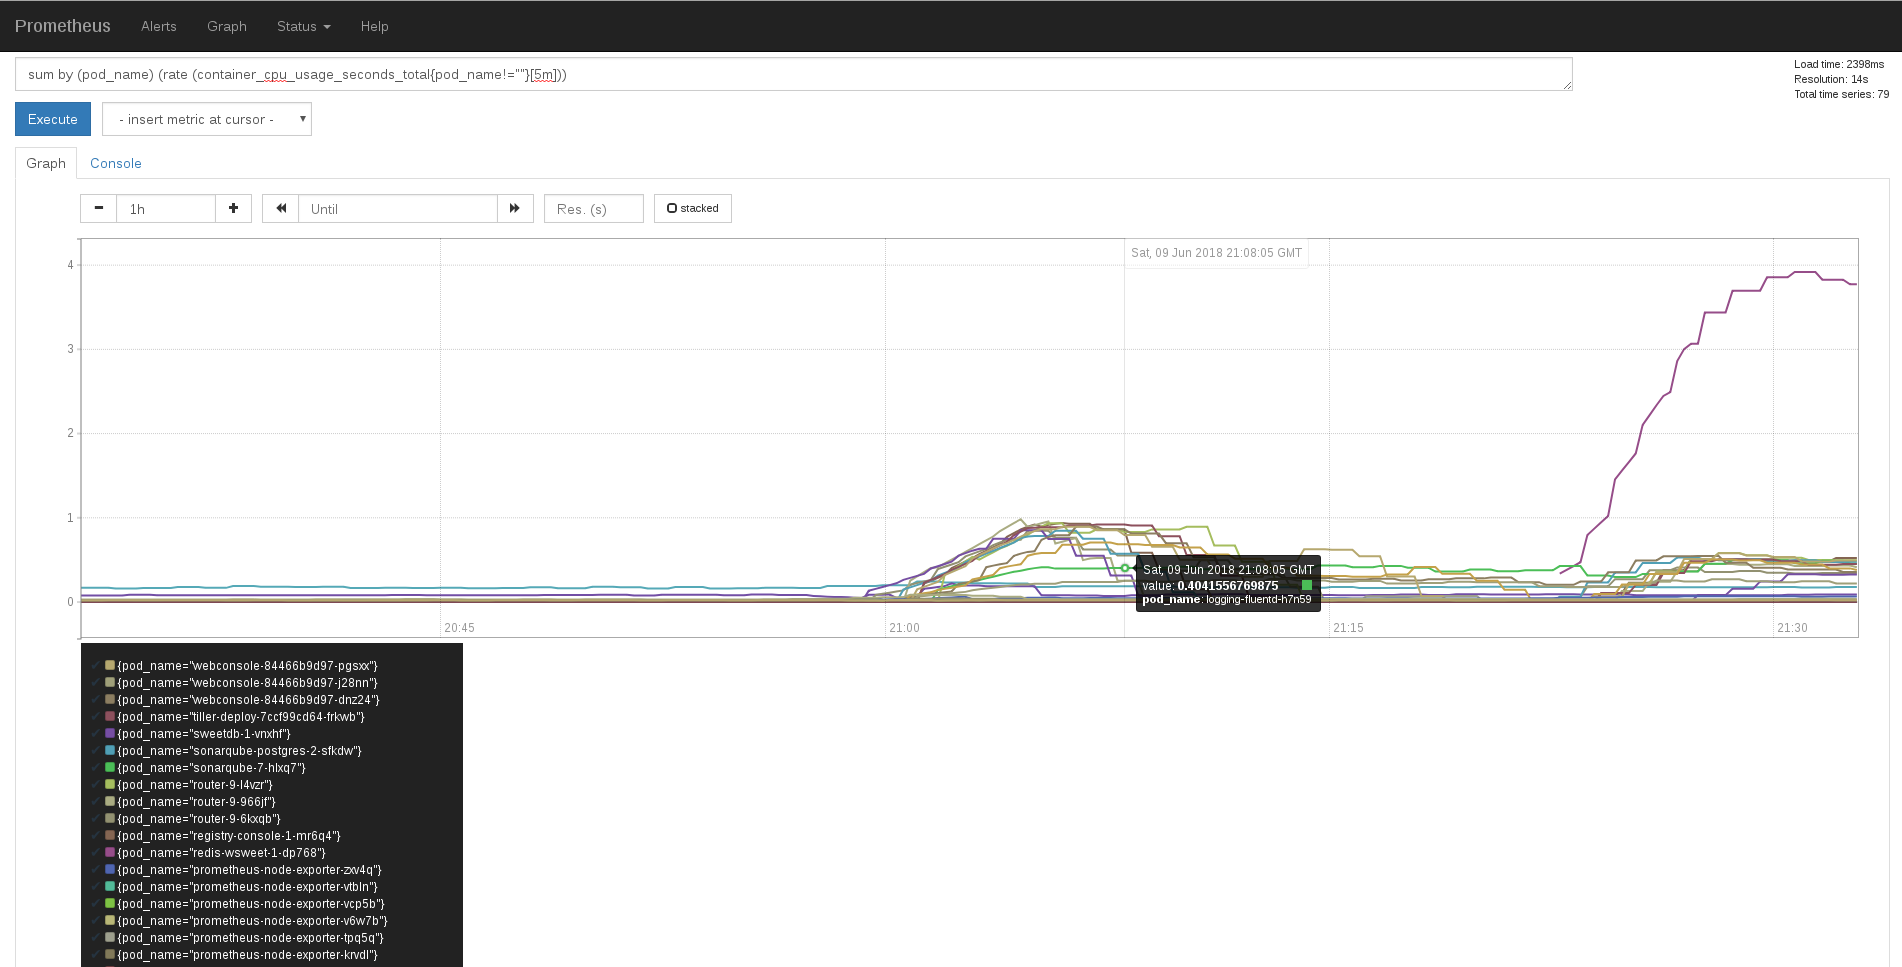
Prometheus showing OpenShift Pods CPU usages

openshift_prometheus_alertbuffer_pvc_size: 20Gi
openshift_prometheus_alertbuffer_storage_class: ceph-storage
openshift_prometheus_alertbuffer_storage_type: pvc
openshift_prometheus_alertmanager_pvc_size: 20Gi
openshift_prometheus_alertmanager_storage_class: ceph-storage
openshift_prometheus_alertmanager_storage_type: pvc
openshift_prometheus_namespace: openshift-metrics
openshift_prometheus_node_selector: {“region”:”infra”}
openshift_prometheus_pvc_size: 20Gi
openshift_prometheus_state: present
openshift_prometheus_storage_class: ceph-storage
openshift_prometheus_storage_type: pvc


We could also deploy some Grafana, that could include a pre-configured dashboard, rendering some Prometheus metrics – thanks to the playbooks/openshift-grafana/config.yml playbook and the following Ansible variables:

Grafana

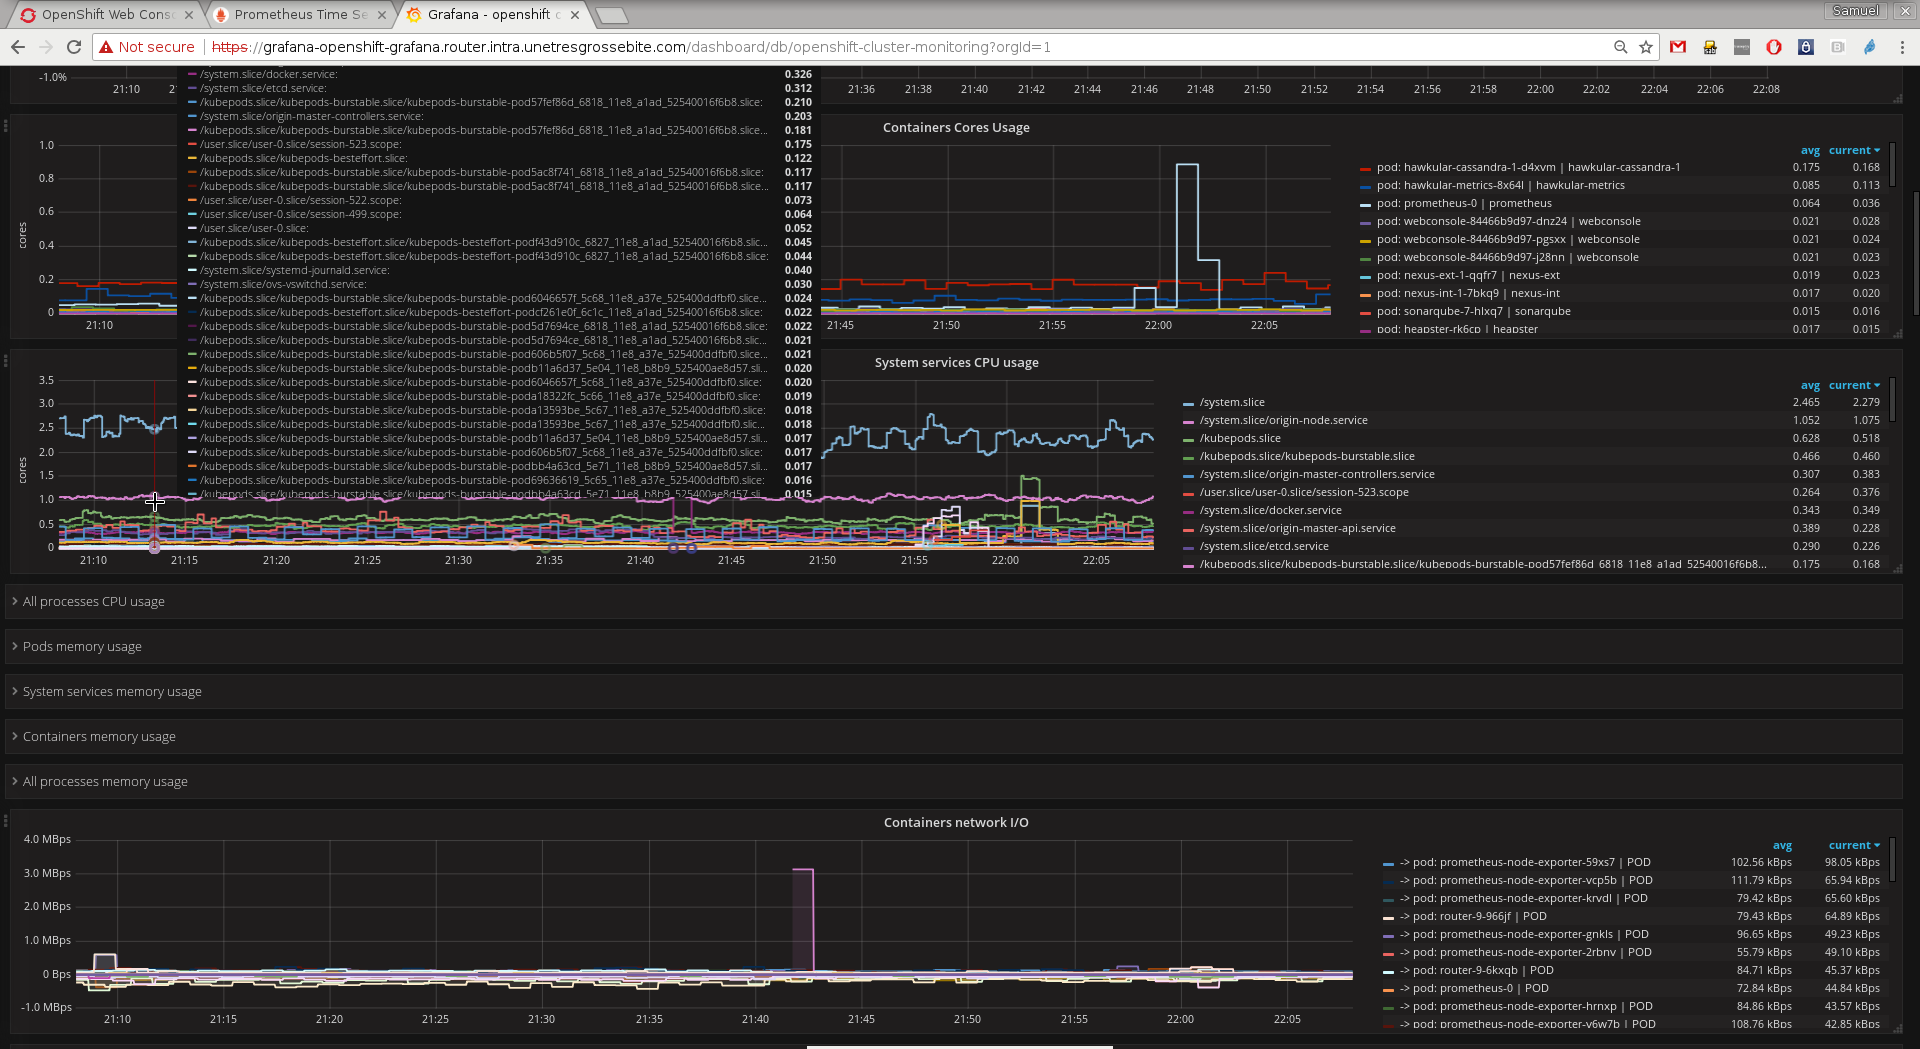
OpenShift Dashboard on Grafana

openshift_grafana_datasource_name: prometheus
openshift_grafana_graph_granularity: 2m
openshift_grafana_namespace: openshift-grafana
openshift_grafana_node_exporter: True
openshift_grafana_node_selector: {“region”:”infra”}
openshift_grafana_prometheus_namespace: openshift-metrics
openshift_grafana_prometheus_serviceaccount: prometheus
openshift_grafana_storage_class: ceph-storage
openshift_grafana_storage_type: pvc
openshift_grafana_storage_volume_size: 15Gi


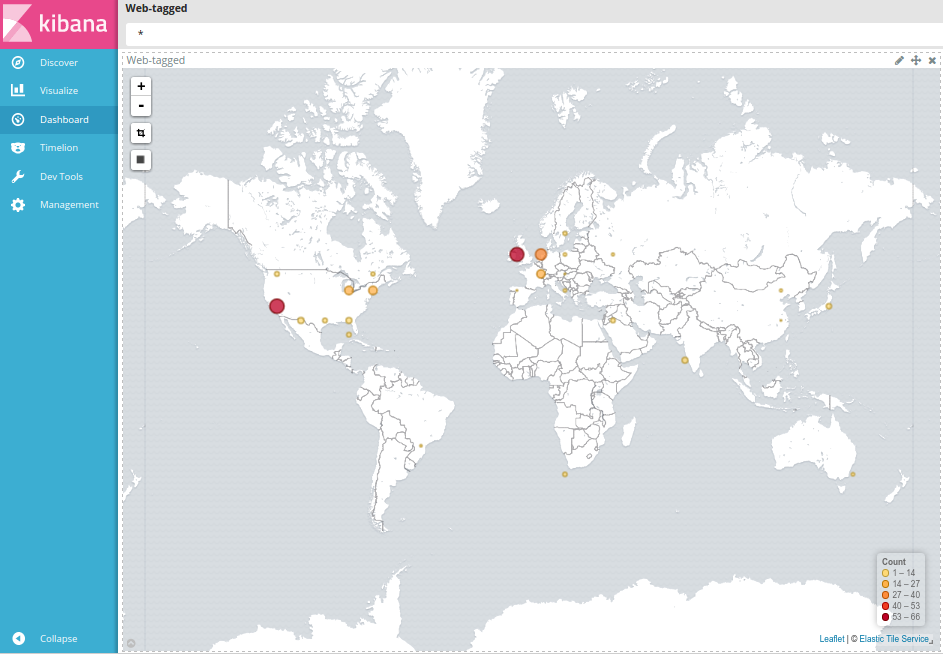
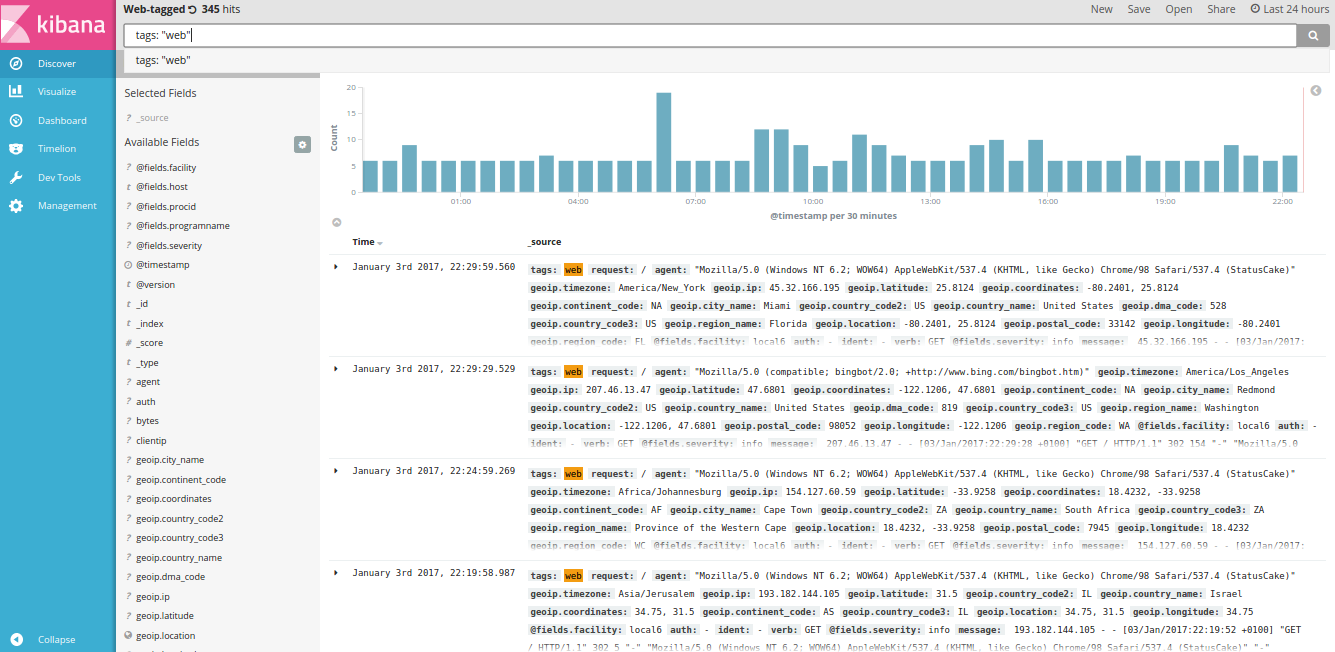
And finally, we could also deploy logs centralization with the playbooks/openshift-logging/config.yml playbook, setting the following:

Kibana

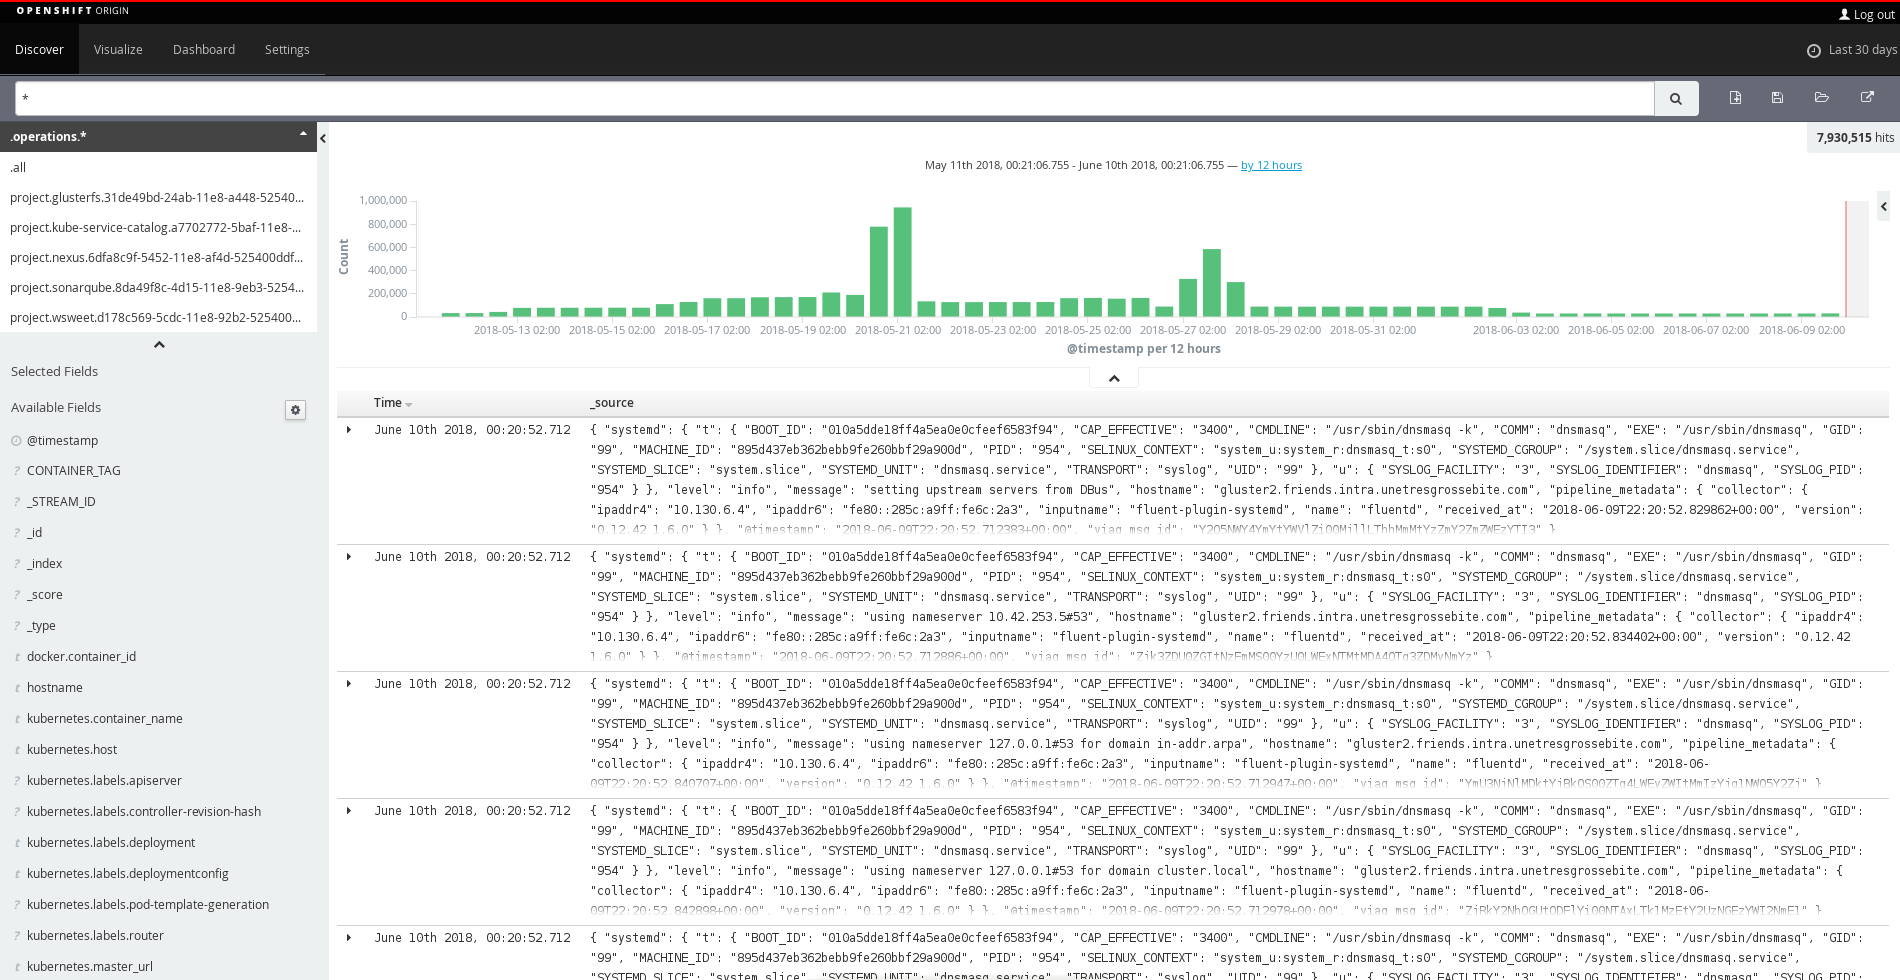
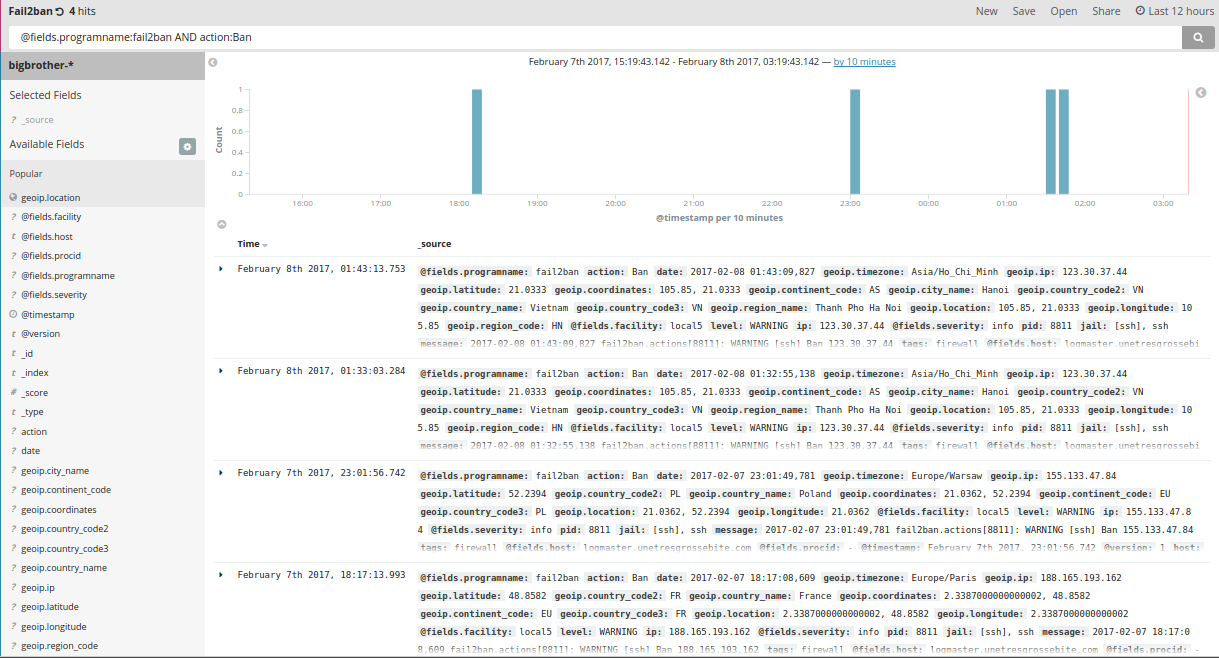
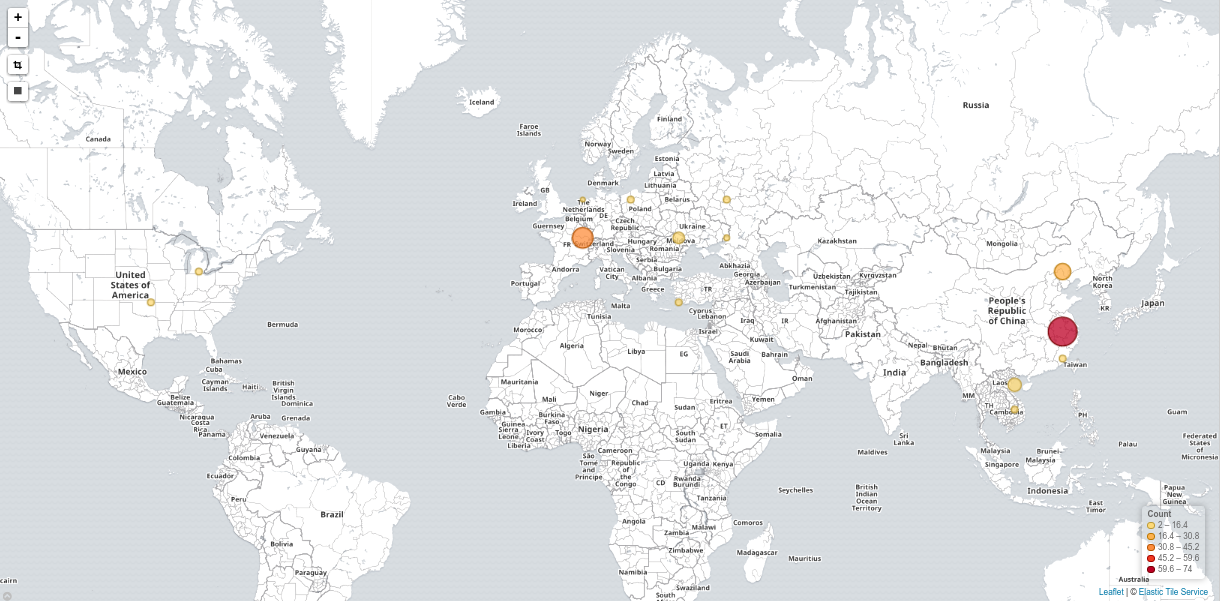
Kibana integration with EFK

openshift_logging_install_logging: True
openshift_logging_curator_default_days: ‘7’
openshift_logging_curator_cpu_request: 100m
openshift_logging_curator_memory_limit: 256Mi
openshift_logging_curator_nodeselector: {“region”:”infra”}
openshift_logging_elasticsearch_storage_type: pvc
openshift_logging_es_cluster_size: ‘1’
openshift_logging_es_cpu_request: ‘1’
openshift_logging_es_memory_limit: 8Gi
openshift_logging_es_pvc_storage_class_name: ceph-storage
openshift_logging_es_pvc_dynamic: True
openshift_logging_es_pvc_size: 25Gi
openshift_logging_es_recover_after_time: 10m
openshift_logging_es_nodeslector: {“region”:”infra”}
openshift_logging_es_number_of_shards: ‘1’
openshift_logging_es_number_of_replicas: ‘0’
openshift_logging_fluentd_buffer_queue_limit: 1024
openshift_logging_fluentd_buffer_size_limit: 1m
openshift_logging_fluentd_cpu_request: 100m
openshift_logging_fluentd_file_buffer_limit: 256Mi
openshift_logging_fluentd_memory_limit: 512Mi
openshift_logging_fluentd_nodeselector: {“region”:”infra”}
openshift_logging_fluentd_replica_count: 2
openshift_logging_kibana_cpu_request: 600m
openshift_logging_kibana_hostname: kibana.router.intra.unetresgrossebite.com
openshift_logging_kibana_memory_limit: 736Mi
openshift_logging_kibana_proxy_cpu_request: 200m
openshift_logging_kibana_proxy_memory_limit: 256Mi
openshift_logging_kibana_replica_count: 2
openshift_logging_kibana_nodeselector: {“region”:”infra”}


Meanwhile we could note that cri-o is getting better support in the latter versions of OpenShift, among a never-ending list of ongoing works and upcoming features.

OpenShift

As of late 2017, I got introduced to OpenShift. Even though I’ve only been playing with a few basic features, nesting Docker into static KVMs,  I was pretty impressed by the simplicity of services deployment, as served to end-users.

After replacing 4x MicroServer, by 3x SE318m1

After replacing 4x MicroServer, by 3x SE318m1

I’ve first tried setting my own, re-using my ProLian MicroServers. One of my master node was refusing to deploy, CPU usage averaging around 100%, systemctl consistently timing out while starting some process – that did start on my two other master nodes.
After trying to resize my KVMs in vain, I eventually went another way: shut down a stair of ProLian MicroServer, move them out of my rack and plug instead 3 servers I ordered a couple years ago, that never reached prod – due to doubts regarding overall power consumption, EDF being able to deliver enough Amperes, my switches not being able to provide with enough LACP channels, my not having enough SSDs or quad-port Ethernet cards in stock to fill these servers,  …

I eventually compromised, and harvested any 500G SSDs disks available out of my Ceph cluster, mounting one per 1U server.

Final setup involves the following physical servers:

  • a custom tower (core i5, 32G DDR, 128G SSD disk)
  • 3x HP SE316M1 (2xE5520, 24G DDR) – 500G SSD
  • 2x HP SE1102 (2xE5420 12G DDR) – 500G SSD
  • 3x ProLian MicroServer G5 (Turion, 4-8G DDR) – 64G SSD + 3×3-4T HDD

And on top of these, a set of KVM instances, including:

  • 3 master nodes (2 CPU, 8G RAM)
  • 3 infra nodes (2 CPU, 6G RAM)
  • 3 compute nodes (4 CPU, 10G RAM @SE316M1)
  • 3 storage nodes (1 CPU, 3G RAM @MicroServer)

Everything running on CentOS7. Except for some Ansible DomU I would use deploying OpenShift, running Debian Stretch.


OpenShift can be deployed using Ansible. And as I’ve been writing my own roles for the past couple years, I can testify these ones are amazing.

GlusterFS @OpenShift

GlusterFS @OpenShift

First ansible run would be done setting the following variables, bootstrapping service on top of my existing domain name, and LDAP server.

ansible_ssh_user: root
openshift_deployment_type: origin
openshift_disable_check: disk_availability,docker_storage,memory_availability
openshift_master_cluster_method: native
openshift_master_cluster_hostname: openshift.intra.unetresgrossebite.com
openshift_master_cluster_public_hostname: openshift.intra.unetresgrossebite.com
openshift_master_default_subdomain: router.intra.unetresgrossebite.com
openshift.common.dns_domain: openshift.intra.unetresgrossebite.com
openshift_clock_enabled: True
openshift_node_kubelet_args: {‘pods-per-core’: [’10’], ‘max-pods’: [‘250’], ‘image-gc-high-threshold’: [’90’], ‘image-gc-low-threshold’: [’80’]}
openshift_master_identity_providers:
– name: UneTresGrosseBite
  challenge: ‘true’
  login: ‘true’
  kind: LDAPPasswordIdentityProvider
  attributes:
    id: [‘dn’]
    email: [‘mail’]
    name: [‘sn’]
    preferredUsername: [‘uid’]
  bindDN: cn=openshift,ou=services,dc=unetresgrossebite,dc=com
  bindPassword: secret
  ca: ldap-chain.crt
  insecure: ‘false’
  url: ‘ldaps://netserv.vms.intra.unetresgrossebite.com/ou=users,dc=unetresgrossebite,dc=com?uid?sub?(&(objectClass=inetOrgPerson)(!(pwdAccountLockedTime=*)))’
openshift_master_ldap_ca_file: /root/ldap-chain.crt

Setting up glusterfs, note you may have difficulties setting gluster block devices as group vars, and could find a solution sticking to defining these directly into your inventory file:

[glusterfs]
gluster1.friends.intra.unetresgrossebite.com glusterfs_ip=10.42.253.100 glusterfs_devices='[ “/dev/vdb”, “/dev/vdc”, “/dev/vdd” ]’
gluster2.friends.intra.unetresgrossebite.com glusterfs_ip=10.42.253.101 glusterfs_devices='[ “/dev/vdb”, “/dev/vdc”, “/dev/vdd” ]’
gluster3.friends.intra.unetresgrossebite.com glusterfs_ip=10.42.253.102 glusterfs_devices='[ “/dev/vdb”, “/dev/vdc”, “/dev/vdd” ]’

Apply the main playbook with:

ansible-playbook playbooks/byo/config.yml -i ./hosts

Have a break: with 4 CPUs & 8G RAM on my ansible host, applying a single variable change (pretty much everything was installed beforehand), I would still need over an hour and a half applying the full playbook: whenever possible, stick to whatever service-specific playbook you may find, …

Jenkins @OpenShift

Jenkins @OpenShift

As a sidenote, be careful to properly set your domain name before deploying glusterfs. So far, while I was able to update my domain name almost everywhere running Ansible playbooks back, GlusterFS’s hekiti route was the first I noticed not being renamed.
Should you fuck up your setup, you can use oc project glusterfs then oc get pods to locate your running containers, use oc rsh <container> then rm -fr /var/lib/hekiti to purge stuff that may prevent further deployments, …
Then oc delete project glusterfs, to purge almost everything else.
You may also use running docker images | grep gluster and docker rmi <images>, … As well as making sure to wipe the first sectors of your gluster disks (for d in b c d; do dd if=/dev/zero of=/dev/vd$d bs=1M count=8; done). You may need to reboot your hosts (if a wipefs -a /dev/drive returns with an error). Finally, re-deploy a new GlusterFS cluster from scratch using Ansible.


Once done with the main playbook, you should be able to log into your OpenShift dashboard. Test it by deploying Jenkins.

hawkular @OpenShift

Hawkular integration @OpenShift


You could (should) also look into deploying OpenShift cluster metrics collection, based on Hawkular & Heapster.
Sticking with volatile storage, you would need adding the following variable to all your hosts:


openshift_metrics_install_metrics: True

Note to deploy these roles, you would have to install on your Ansible host (manually!) python-passlib, apache2-utils and openjdk-8-jdk-headless (assuming Debian/Ubuntu). You may then deploy metrics using the playbooks/byo/openshift-cluster/openshift-metrics.yml playbook.

Hawkular integration would allow you to track resources usage directly from OpenShift dashboard.

Prometheus @OpenShift

Prometheus @OpenShift

You could also setup Prometheus defining the following:

openshift_prometheus_namespace: openshift-metrics
openshift_prometheus_node_selector: {“region”:”infra”}

And applying the playbooks/byo/openshift-cluster/openshift-prometheus.yml playbook.


You should also be able to setup some kind of centralized logging based on ElasticSearch, Kibana & Fluentd, using the following:

openshift_logging_install_logging: True
openshift_logging_kibana_hostname: kibana.router.intra.unetresgrossebite.com
openshift_logging_es_memory_limit: 4Gi
openshift_logging_storage_kind: dynamic
openshift_cloudprovider_kind: glusterfs

Although so far, I wasn’t able to get it running properly ElasticSearch health is stuck to yellow, while Kibana and Fluentd can’t reach it somehow, could be due to a missing DNS record.


From there, you would find plenty solutions, packaged for OpenShift, ready to deploy (a popular one seems to be Go Git Server).
Deploying new services can still be a little painful, although there’s no denying OpenShift offers with a potentially amazing SAAS toolbox.

Graphite & Riemann

There are several ways of collecting runtime metrics out of your software. We’ve discussed of Munin or Datadog already, we could talk about Collectd as well, although these solutions would mostly aim at system monitoring, as opposed to distributed systems.

Business Intelligence may require collecting metrics from a cluster of workers, aggregating them into comprehensive graphs, such as short-living instances won’t imply a growing collection of distinct graphs.


Riemann is a Java web service, allowing to collect metrics over TCP or UDP, and serving with a simple web interface generating dashboards, displaying your metrics as they’re received. Configuring Riemann, you would be able to apply your input with transformations, filtering, … You may find a quickstart here, or something more exhaustive over there. A good starting point could be to keep it simple:

(logging/init {:file “/var/log/riemann/riemann.log”})
(let [host “0.0.0.0”]
(tcp-server {:host host})
(ws-server {:host host}))
(periodically-expire 5)
(let [index (index)] (streams (default :ttl 60 index (expired (fn [event] (info “expired” event))))))

Riemann Sample Dashboard

Riemann Sample Dashboard

Despite being usually suspicious of Java applications or Ruby web services, I tend to trust Riemann even under heavy workload (tens of collectd, forwarding hundreds of metrics per second).

Riemann Dashboard may look unappealing at first, although you should be able to build your own monitoring screen relatively easily. Then again, this would require a little practice, and some basic sense of aesthetics.


Graphite Composer

Graphite Composer

Graphite is a Python web service providing with a minimalist yet pretty powerful browser-based client, that would allow you to render graphs. Basic Graphite setup would usually involve some SQlite database storing your custom graphs and users, as long as another Python service: Carbon, storing metrics. Such setup would usually also involve Statsd, a NodeJS service listening for metrics, although depending on what you intend to monitor, you might find your way into writing to Carbon directly.

Setting up Graphite on Debian Stretch may be problematic, due to some python packages being deprecated, while the last Graphite packages aren’t available yet. After unsuccessfully trying to pull copies from PIP instead of APT, I eventually ended up setting my first production instance based on Devuan Jessie. Setup process would drastically vary based on distribution, versions, your web server, Graphite database, … Should you go there: consider all options carefully before starting.

Graphite could be used as is: the Graphite Composer would let you generate and save graphs, aggregating any collected metric, while the Dashboard view would let you aggregate several graphs into a single page. Although note you could use Graphite as part of Grafana as well, among others.


From there, note Riemann can be reconfigured forwarding everything to Graphite (or using your own filters), adding to your riemann.config:

(def graph (graphite {:host “10.71.100.164”}))
(streams graph)

This should allow you to run Graphite without Statsd, having Riemann collecting metrics from your software and forwarding them into Carbon.


The next step would be to configure your applications, forwarding data to Riemann (or Statsd, should you want to only use Graphite). Databases like Cassandra or Riak could forward some of their own internal metrics, using the right agent. Or, collecting BI metrics from your own code.

Graphite Dashboard

Graphite Dashboard

Using NodeJS, you will find a riemannjs module that does the job. Or node-statsd-client, for Statsd.

Having added some scheduled tasks to our code, querying for how many accounts we have, how many are closed, how many were active during the last day, week and month, … I’m eventually able to create a dashboard based on saved graphs, aggregating metrics in some arguably-meaningful fashion.

Lying DNS

As I was looking at alternative web browsers, with privacy in mind, I ended up installing Iridium (in two words: Chrome fork), tempted to try it out. I first went to Youtube, and after my first video, was being subjected to one of these advertisement sneaking in between videos, that horrible “skip add” button after a few seconds, … I was shocked enough, to open Chromium back.

This is a perfect occasion to discuss about lying DNS servers, and how having your own cache can help you clean up your web browsing experience from at least part of these unsolicited intrusions.

We would mainly talk about a lying DNS server (or cache, actually) alongside Internet censorship, whenever an operator either refuses to serve DNS records or diverts them somewhere else.
Yet some of the networks I manage may relay on DNS resolvers that would purposefully prevent some records from being resolved.

You may query google for lists of domain names likely to host irrelevant contents. These are traditionally formatted as an hosts file, and may be used as is on your computer, assuming you won’t need serving these records to other stations in your LAN.

Otherwise, servers such as Dnsmasq, Unbound or even Bind (using RPZ, although I would recommend sticking to Unbound) may be configured overwriting records for a given list of domains.
Currently, I trust a couple sites to provide me with a relatively exhaustive list of unwanted domain names, using a script to periodically re-download these, while merging them with my own blacklist (see my puppet modules set for further details on how I configure Unbound). I wouldn’t recommend this to anyone: using dynamic lists is risky to begin with … Then again, I wouldn’t recommend a beginner to setup his own DNS server: editing your own hosts file could be a start, though.

Instead of yet another conf dump, I’ld rather point to a couple posts I used when setting it up: the first one from Calomel (awesome source of sample configurations running on BSD, check it out, warmest recommendations …) and an other one from a blog I didn’t remember about – although I’ve probably found it at some point in the past, considering we pull domain names from the same sources…

HighWayToHell

Quick post promoting HighWayToHell, a project I posted to GitHub recently, aiming to provide with a self-hosted Route53 alternative, that would include DNSSEC support.

Assuming you may not be familiar with Route53, the main idea is to generate DNS zones configuration based on conditionals.

edit health check

edit health check

We would then try to provide with a lightweight web service to manage DNS zones, their records, health checks and notifications. Contrarily to Route53: we would implement DNSSEC support.

HighWayToHell distribution

HighWayToHell distribution

HighWayToHell works with a Cassandra cluster storing persistent records, and at least one Redis server (pubsub, job queues, ephemeral tokens). Operations are split in four workers: one in charge of running health checks, an other one of sending notifications based on health checks last returned values and user-defined thresholds, a third one is in charge of generating DNS (bind or NSD) zone include files and zones configurations, the last worker implements an API gateway providing with a lightweight web app.

Theoretically, it could all run on one server, although hosting a DNS setup, you’ll definitely want to involve at least a pair of name servers, and probably want to use separate instances running your web frontend, or dealing with health checks.

list records

list records

Having created your first account, registered your first domain, you would be able to define your first health checks and DNS records.

add record

update record

You may grant third-party users with a specific roles accessing resources from your domains. You may enable 2FA on your accounts using apps such as Authy. You may create and manage tokens – to be used alongside our curl-based shell client, …

delegate management

delegate management

This is a couple weeks old project I didn’t have much time to work on, yet it should be exhaustive and reliable enough to fulfill my original expectations. Eventually, I’ll probably add an API-less management CLI: there still is at least one step, starting your database, that still requires inserting records manually, …

Curious to know more? See our QuickStart docs!

Any remark, bug-report or PR most welcome. Especially CSS contributions – as this is one of the rare topic I can’t bear having to deal with.

KeenGreeper

Short post today, introducing KeenGreeper, a project I freshly released to GitHub, aiming to replace Greenkeeper 2.

For those of you that may not be familiar with Greenkeeper, they provide with a public service that integrates with GitHub, detects your NodeJS projects dependencies and issues a pull request whenever one of these may be updated. In the last couple weeks, they started advertising about their original service being scheduled for shutdown, while Greenkeeper 2 was supposed to replace it. Until last week, I’ve only been using Greenkeeper free plan, allowing me to process a single private repository. Migrating to GreenKeeper 2, I started registering all my NodeJS repositories and only found out 48h later that it would cost me 15$/month, once they would have definitely closed the former service.

Considering that they advertise on their website the new version offers some shrinkwrap support, while in practice outdated wrapped libraries are just left to rot, … I figured writing my own scripts collection would definitely be easier.

keengreeper lists repositories, ignored packages, cached versions

keengreeper lists repositories, ignored packages, cached versions

That first release addresses the first basics, adding or removing repositories to some track list, adding or removing modules to some ignore list, preventing their being upgraded. Resolving the last version for a package from NPMJS repositories, and keeping these in a local cache. Works with GitHub as well as any ssh-capable git endpoint. Shrinkwrap libraries are actually refreshed, if such are present. Whenever an update is available, a new branch is pushed to your repository, named after the dependency and corresponding version.

refresh logs

refresh logs

Having registered your first repositories, you may run the update job manually and confirm everything works. Eventually, setup a cron task executing our job script.

Note that right now, it is assumed the user running these scripts has access to a SSH key granting it with write privileges to our repositories, pushing new branches. Now ideally, either you run this from your laptop and can assume using your own private key is no big deal, or I would recommend creating a third-party GitHub user, with its own SSH key pair, and grant it read & write access to the repositories you intend to have it work with.

repositories listing

repositories listing

Being a 1 day DYI project, every feedback is welcome, GitHub is good place to start, …

PM2

systemctl integration

systemctl integration

PM2 is a NodeJS processes manager. Started on 2013 on GitHub, PM2 is currently the 82nd most popular JavaScript project on GitHub.


PM2 is portable, and would work on Mac or Windows, as well as Unices. Integrated with Systemd, UpStart, Supervisord, … Once installed, PM2 would work as any other service.


The first advantage of introducing PM2, whenever dealing with NodeJS services, is that you would register your code as a child service of your main PM2 process. Eventually, you would be able to reboot your system, and recover your NodeJS services without adding any scripts of your own.

pm2 processes list

pm2 processes list

Another considerable advantage of PM2 is that it introduces clustering capabilities, most likely without requiring any change to your code. Depending on how your application is build, you would probably want to have at least a couple processes for each service that serves users requests, while you could see I’m only running one copy of my background or schedule processes:


nodejs sockets all belong to a single process

nodejs sockets all belong to a single process

Having enabled clustering while starting my foreground, inferno or filemgr processes, PM2 would start two instances of my code. Now one could suspect that, when configuring express to listen on a static port, starting two processes of that code would fail with some EADDRINUSE code. And that’s most likely what would happen, when instantiating your code twice. Yet when starting such process with PM2, the latter would take over socket operations:

And since PM2 is processing network requests, during runtime: it is able to balance traffic to your workers. While when deploying new revisions of your code, you may gracefully reload your processes, one by one, without disrupting service at any point.

pm2 process description

pm2 process description

PM2 also allows to track per-process resources usage:

Last but not least, PM2 provides with a centralized dashboard. Full disclosure: I only enabled this feature on one worker, once. And wasn’t much convinced, as I’m running my own supervision services, … Then again, you could be interested, if running a small fleet, or if ready to invest on Keymetrics premium features. Then again, it’s worth mentioning that your PM2 processes may be configured forwarding metrics to Keymetrics services, so you may keep an eye on memory or CPU usages, application versions, or even configure reporting, notifications, … In all fairness, I remember their dashboard looked pretty nice.

pm2 keymetrics dashboard, as advertised on their site

pm2 keymetrics dashboard, as advertised on their site

Fail2ban & ELK

Following up on a previous post regarding Kibana and ELK5 recent release, today we’ll follow up configuring some map visualizing hosts as Fail2ban blocks them.

Having installed Fail2ban and configured the few jails that are relevant for your system, look for Fail2ban log file path (variable logtarget, defined in /etc/fail2ban/fail2ban.conf, defaults to /var/log/fail2ban.log on debian).

The first thing we need is to have our Rsyslog processing Fail2ban logs. Here, we would use Rsyslog file input module (imfile), and force using FQDN instead of hostnames.

$PreserveFQDN on
module(load=”imfile” mode=”polling” PollingInterval=”10″)
input(type=”imfile”
  File=”/var/log/fail2ban.log”
  statefile=”/var/log/.fail2ban.log”
  Tag=”fail2ban: ”
  Severity=”info”
  Facility=”local5″)

Next, we’ll configure Rsyslog forwarding messages to some remote syslog proxy (which will, in turn, forward its messages to Logstash). Here, I usually rely on rsyslog RELP protocol (may require installing rsyslog-relp package), as it addresses some UDP flaws, without shipping with traditional TCP syslog limitations.

Relaying syslog messages to our syslog proxy: load in RELP output module, then make sure your Fail2ban logs would be relayed.

$ModLoad omrelp
local5.* :omrelp:rsyslog.example.com:6969

Before restarting Rsyslog, if it’s not already the case, make sure the remote system would accept your logs. You would need to load Rsyslog RELP input module. Make sure rsyslog-relp is installed, then add to your rsyslog configuration

$ModLoad imrelp
$InputRELPServerRun 6969

You should be able to restart Rsyslog on both your Fail2ban instance and syslog proxy.

Relaying messages to Logstash, we would be using JSON messages instead of traditional syslog formatting. To configure Rsyslog forwarding JSON messages to Logstash, we would use the following

template(name=”jsonfmt” type=”list” option.json=”on”) {
    constant(value=”{“)
    constant(value=”\”@timestamp\”:\””) property(name=”timereported” dateFormat=”rfc3339″)
    constant(value=”\”,\”@version\”:\”1″)
    constant(value=”\”,\”message\”:\””) property(name=”msg”)
    constant(value=”\”,\”@fields.host\”:\””) property(name=”hostname”)
    constant(value=”\”,\”@fields.severity\”:\””) property(name=”syslogseverity-text”)
    constant(value=”\”,\”@fields.facility\”:\””) property(name=”syslogfacility-text”)
    constant(value=”\”,\”@fields.programname\”:\””) property(name=”programname”)
    constant(value=”\”,\”@fields.procid\”:\””) property(name=”procid”)
    constant(value=”\”}\n”)
  }
local5.* @logstash.example.com:6968;jsonfmt

Configuring Logstash processing Fail2ban logs, we would first need to define a few patterns. Create some /etc/logstash/patterns directory. In there, create a file fail2ban.conf, with the following content:

F2B_DATE %{YEAR}-%{MONTHNUM}-%{MONTHDAY}[ ]%{HOUR}:%{MINUTE}:%{SECOND}
F2B_ACTION (\w+)\.(\w+)\[%{POSINT:pid}\]:
F2B_JAIL \[(?\w+\-?\w+?)\]
F2B_LEVEL (?\w+)\s+

Then, configuring Logstash processing these messages, we would define an input dedicated to Fail2ban. Having tagged Fail2ban events, we will apply a Grok filter identifying blocked IPs and adding geo-location data. We’ll also include a sample output configuration, writing to ElasticSearch.

input {
  udp {
    codec => json
    port => 6968
    tags => [ “firewall” ]
  }
}

filter {
  if “firewall” in [tags] {
    grok {
      patterns_dir => “/etc/logstash/patterns”
      match => {
        “message” => [
          “%{F2B_DATE:date} %{F2B_ACTION} %{F2B_LEVEL:level} %{F2B_JAIL:jail} %{WORD:action} %{IP:ip} %{GREEDYDATA:msg}?”,
          “%{F2B_DATE:date} %{F2B_ACTION} %{WORD:level} %{F2B_JAIL:jail} %{WORD:action} %{IP:ip}”
        ]
      }
    }
    geoip {
      source => “ip”
      target => “geoip”
      database => “/etc/logstash/GeoLite2-City.mmdb”
      add_field => [ “[geoip][coordinates]”, “%{[geoip][longitude]}” ]
      add_field => [ “[geoip][coordinates]”, “%{[geoip][latitude]}” ]
    }
    mutate {
      convert => [ “[geoip][coordinates]”, “float” ]
    }
  }
}

output {
  if “_check_logstash” not in [tags] and “_grokparsefailure” not in [tags] {
    elasticsearch {
      hosts => [ “elasticsearch1.example.com”, “elasticsearch2.example.com”, “elasticsearch3.example.com” ]
      index => “rsyslog-%{+YYYY.MM.dd}”
    }
  }
  if “_grokparsefailure” in [tags] {
    file { path => “/var/log/logstash/failed-%{+YYYY-MM-dd}.log” }
  }
}

Note that if I would have recommended using RELP inputs last year, running Logstash 2.3: as of Logstash 5 this plugin is no longer available. Hence I would recommend setting up some Rsyslog proxy on your Logstash instance, in charge of relaying RELP messages as UDP ones to Logstash, through your loopback.

Moreover: assuming you would need to forward messages over a public or un-trusted network, then using Rsyslog RELP modules could be used with Stunnel encapsulation. Whereas running Debian, RELP output with TLS certificates does not seem to work as of today.

That being said, before restarting Logstash, if you didn’t already, make sure to define a template setting geoip type to geo_point (otherwise shows as string and won’t be usable defining maps). Create some index.json file with the following:

{
  “mappings”: {
    “_default_”: {
      “_all”: { “enabled”: true, “norms”: { “enabled”: false } },
      “dynamic_templates”: [
        { “template1”: { “mapping”: { “doc_values”: true, “ignore_above”: 1024, “index”: “not_analyzed”, “type”: “{dynamic_type}” }, “match”: “*” } }
      ],
      “properties”: {
        “@timestamp”: { “type”: “date” },
        “message”: { “type”: “string”, “index”: “analyzed” },
        “offset”: { “type”: “long”, “doc_values”: “true” },
        “geoip”: { “type” : “object”, “dynamic”: true, “properties” : { “location” : { “type” : “geo_point” } } }
      }
    }
  },
  “settings”: { “index.refresh_interval”: “5s” },
  “template”: “rsyslog-*”
}

kibana search

kibana search

Post your template to ElasticSearch

root@logstash# curl -XPUT http://elasticsearch.example.com:9200/_template/rsyslog?pretty -d@index.json

You may now restart Logstash. Check logs for potential errors, …

kibana map

kibana map

Now to configure Kibana: start by searching for Fail2ban logs. Save your search, so it can be re-used later on.

Then, in the Visualize panel, create a new Tile Map visualization, pick the search query you just saved. You’re being asked to select bucket type: click on Geo Coordinates. Insert a Label, click the Play icon to refresh the sample map on your right. Save your Visualization once you’re satisfied: these may be re-used defining Dashboards.

UniFi

While upgrading my network, I stumbled upon some UniFi access point a friend left over, a few months ago. It’s been lying there long enough, today I’m powering it on.

UniFi are Ubiquiti devices. If you are not familiar with these, Ubiquiti aims to provide with network devices (switch, router, network cameras, access points) that are controlled by a centralized web service. Once a device is paired with your controller, the VLANs, SSIDs, … you’ve already defined would be automatically deployed. Although I’m not at all familiar with their routers, switches or network cameras, I already worked with their access points covering large offices with several devices, roaming, VLANs, freeradius, automated firmware upgrades, PoE, … These access points can do it all, have a pretty good range of action in comparison with the world-famous WRT54-G, and can serve 100s of users simultaneously.

site settings

site settings

Unifi is also the name of the controller you would install on some virtual machine, managing your devices. Having installed their package on your system, you should be able to connect on your instance’s port 8443 using https. Once you’ld have created your administrative user, then a default SSID: you would be able to discover devices in your network, and pair them to your controller.

The Unifi controller allows you to define a syslog host, SNMP community string, … And also shows a checkbox to “enable DPI”, which requires an USG (Unifi Security Gateway). Pretty much everything is configured from this panel.

map

Map

The Unifi controller would also allow you to import maps of the locations you’re covering. I could recommend Sweet Home 3D to quickly draw such map. On a small setup like mine, this is mostly bling-bling, still it’s pretty nice to have.

events

events

The controller provides with a centralized log, archiving events such as firmware updates, clients connections, when a user experienced with some interference, … Pretty exhaustive.

client

client

The controller also offers with detailed statistics per SSID, access point, client device, … allow tagging or blocking hardware addresses.

stats

stats

Unifi intends to provide with enterprise-grade devices, and yet their cheapest access points prices are comparable to the kind of SoHo solutions we all have running our home network.

Even though you would never use most of the features of their controller, and even if you do not need to deploy several access points covering your area, UniFi access points can still be relevant for their ease of use, features set and shiny manager. And especially if your setup involves several devices with similar configurations: you’ll definitely want to give UniFi a shot.

Kibana

Kibana Map

Kibana Map

Kibana is the visible part of a much larger stack, based on ElasticSearch, a distributed search engine based on Lucene, providing with full-text searches via some restful HTTP web service.

Kibana used to be a JavaScript application running from your browser, querying some ElasticSearch cluster and rendering graphs, maps, … listing, counting, … A couple versions ago, kibana was rewritten as a NodeJS service. Nowadays, Kibana can even be used behind a proxy, allowing you to configure some authentication, make your service public, …

ElasticSearch on the other hand, is based on Java. Latest versions would only work with Java 8. We won’t make an exhaustive changes list, as this is not our topic, although we could mention that ElasticSearch 5 no longer uses their multicast discovery protocol, and instead defaults to unicast. You may find plugins such as X-Pack, that would let you plug your cluster authentication to some LDAP or AD backend, configuring Role-Based Access Control, … the kind of stuff that used to require a Gold plan with Elastic.co. And much more …

One of the most popular setup involving Kibana also includes Logstash, which arguably isn’t really necessary. An alternative to “ELK” (ElasticSearch Logstash Kibana) could be to replace your Logstash by Rsyslog, leveraging its ElasticSearch output module (om-elasticsearch). Then again, Logstash can be relevant assuming you need to apply transformations to your logs (obfuscating passwords, generating geo -locations data from an IP address, …). Among other changes, Logstash 5 requires GeoIP databases to comply with the new MaxMind DB binary format.

Kibana Filters

Kibana Filters

All of these projects are evolving quickly – even syslog, whose 8th version doesn’t look anything like the version 5, that used to be on the previous debian LTS.
Having reinstalled a brand new cluster to celebrate, I had to rewrite my puppet modules deploying ElasticSearch and Kibana, pretty much everything changed, variables renamed, new repositories, introducing Kibana debian packages, …

Kibana as well, was subject to major changes: panels are no longer loaded from Kibana yaml configuration file: something very similar to the previous default dashboard is loaded and you may install additional plugins, as you may already do customizing Logstash or ElasticSearch. Meanwhile, Kibana is finally shipped as a debian archive, corresponding init scripts are properly installed, … Way cleaner, rewriting this puppet module was a pleasure.

Kibana Discovery

Kibana Discovery

Note that the test setup I am currently running is hosted on a tiny Kimsufi box, 4G RAM, Atom 2800 CPU, 40G disk. This server runs ElasticSearch, Kibana, Logstash – and Rsyslog. Such RAM or CPU is kinda small, for ELK. Still, I must say I’m pretty satisfied so far. Kibana dashboard loads in a couple seconds, which is way faster than my recollections running single-node ELKs with previous versions, and definitely faster than running a 3-nodes ELK-4 cluster for a customer of mine.