Menu

Kibana

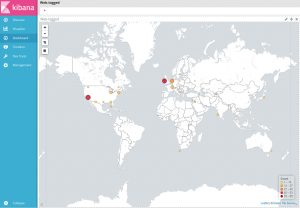
Kibana Map

Kibana Map

Kibana is the visible part of a much larger stack, based on ElasticSearch, a distributed search engine based on Lucene, providing with full-text searches via some restful HTTP web service.

Kibana used to be a JavaScript application running from your browser, querying some ElasticSearch cluster and rendering graphs, maps, … listing, counting, … A couple versions ago, kibana was rewritten as a NodeJS service. Nowadays, Kibana can even be used behind a proxy, allowing you to configure some authentication, make your service public, …

ElasticSearch on the other hand, is based on Java. Latest versions would only work with Java 8. We won’t make an exhaustive changes list, as this is not our topic, although we could mention that ElasticSearch 5 no longer uses their multicast discovery protocol, and instead defaults to unicast. You may find plugins such as X-Pack, that would let you plug your cluster authentication to some LDAP or AD backend, configuring Role-Based Access Control, … the kind of stuff that used to require a Gold plan with Elastic.co. And much more …

One of the most popular setup involving Kibana also includes Logstash, which arguably isn’t really necessary. An alternative to “ELK” (ElasticSearch Logstash Kibana) could be to replace your Logstash by Rsyslog, leveraging its ElasticSearch output module (om-elasticsearch). Then again, Logstash can be relevant assuming you need to apply transformations to your logs (obfuscating passwords, generating geo -locations data from an IP address, …). Among other changes, Logstash 5 requires GeoIP databases to comply with the new MaxMind DB binary format.

Kibana Filters

Kibana Filters

All of these projects are evolving quickly – even syslog, whose 8th version doesn’t look anything like the version 5, that used to be on the previous debian LTS.
Having reinstalled a brand new cluster to celebrate, I had to rewrite my puppet modules deploying ElasticSearch and Kibana, pretty much everything changed, variables renamed, new repositories, introducing Kibana debian packages, …

Kibana as well, was subject to major changes: panels are no longer loaded from Kibana yaml configuration file: something very similar to the previous default dashboard is loaded and you may install additional plugins, as you may already do customizing Logstash or ElasticSearch. Meanwhile, Kibana is finally shipped as a debian archive, corresponding init scripts are properly installed, … Way cleaner, rewriting this puppet module was a pleasure.

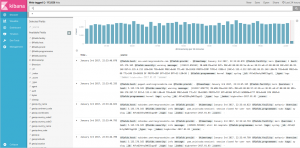
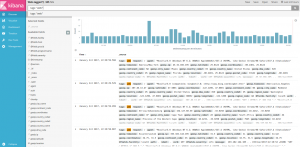
Kibana Discovery

Kibana Discovery

Note that the test setup I am currently running is hosted on a tiny Kimsufi box, 4G RAM, Atom 2800 CPU, 40G disk. This server runs ElasticSearch, Kibana, Logstash – and Rsyslog. Such RAM or CPU is kinda small, for ELK. Still, I must say I’m pretty satisfied so far. Kibana dashboard loads in a couple seconds, which is way faster than my recollections running single-node ELKs with previous versions, and definitely faster than running a 3-nodes ELK-4 cluster for a customer of mine.

Bacula

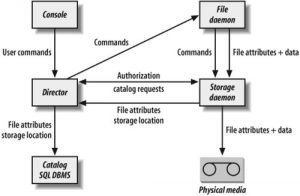
Bacula is a pretty complete backup solution, written in C++, based on three main daemons (file, storage, director) allowing to schedule jobs and restore backups from a given point in time.

Bacula agents

Bacula agents

The director service is in charge of orchestrating all operations (start a backup, start a restore, …) and would store its indexes into some RDBMS (MySQL, PostgreSQL or SQLite). This is where we would be defining our retention policy and schedule our jobs. Bacula also provides with a Console client – as well as various graphical alternatives – that will connect to your director, allowing you to restore files, check for jobs and processes statuses, logs, …

The storage service is in charge of storing and serving backups. Nowadays mostly used with regular drives, NFS or LUN devices, yet can still be configured working with tapes.

slack-notify

slack-notify

The file service is to be installed on all the servers you intend to backup. Upon director request, it would be in charge of collecting and compressing (if configured to do so) the data you’re backing up, before sending it to your storage service.

Backup jobs may be of type Full (backup everything), Differential (capturing changes since last Full backup) or Incremental (capturing changes since last Full, Differential or Incremental backup), which should allow you to minimize disk space usage.

Assuming you can externalize your older backup volumes to off-line disks from time to time, there is no limit to your retention.

bacula-dashboard

bacula-dashboard

Jobs definition may include running commands prior to or after having run your backup, you may also define commands to be run upon failed backup, … director can be configured to limit how much simultaneous jobs should be running, the last versions of bacula also include bandwidth limitations. All in all, making Bacula a very complete and scalable solution.

Bacula wiki lists several graphical clients supervising your backups. As of right now, I preferred sticking to a read-only dashboard, installed on my director instance, with bacula-web (PHP/gd).

CircleCI & Ansible

About a year ago, I started writing some Ansible roles in order to bootstrap the various services involved in hosting Peerio backend.

Running on EC2, using Ansible was an easy way to quickly get my new instances up and running. Moreover, Ansible comes with a few plugins that would allow you to define Route53 records and health checks. Or could even be used creating EC2 Instances or Auto Scale Groups.

Using AWS’s contextualization (USER_DATA), I’m able to pass variables to my booting instances, so that each new machine pulls its copy of our ansible repository, generates a few yamls including “localization” variables (which redis, riak, … http cache should we be using). Then, the boot process applies our main ansible playbook, setting up whatever service was requested in our USER_DATA.

One could argue that running on EC2, I could have prepared distinct templates for each class of service. Which would imply having instances that boot faster. Although the counterpart is that I would need to manage more templates, may forget to update some file somewhere, … Whereas right now, I only need to maintain a couple AMIs (a Jessie image, for pretty much all our services, and a Trusty one, for Riak & RiakCS: despite paying for enterprise support, we’re still unable to get our hands on some package for Debian Jessie or Ubuntu Xenial).

An other advantage of being able to bootstrap our backend using Ansible, is that whenever we would want to assist customers in setting up their own cluster, we do already have reproducible recipes – with some relatively exhaustive documentation.

As of Puppet, Chef, … or any orchestration solution, Ansible is a very powerful tool coding your way through automation. But whenever you write some module, or end up forking and deploying some external project to your setup, you would be subject to potential failures, most of the time syntax errors related, maybe some poorly-set permission, …
Deploying instances, you’re either root or able to assume such privileges, restart a webserver, install packages, replace critical configurations on your systems, … Anything could happen, everything could break.

An other source of risks, in addition to self-authored pebkacs, is depending on external resources. Which could be apt packages, ruby gems, python packages, node modules, …. Even though we can usually trust our system’s official repositories to serve us with a consistent set of packages, whenever we assume we would be able to install some external dependency at boot time, when you need your service to be available already: we are placing a bet, and time would eventually prove us wrong.

A good example of something that is likely to break in my setup these days, is Netdata. This project changes a lot on GitHub.
At some point, their installation script started to source some profile file that was, in some unconfigured instances of mine, running some ‘exec bash’. Moving netdata module inclusion after my shell role got applied was enough to fix.
More recently, their systemctl init script tells me Netdata can not start due some read-only file system. I finally had to replace their init, somehow.
Eventually, I may just patch my Ansible roles pulling Netdata from my own fork on GitHub.

Another sample of something that’s likely to break is NPMJS’s registry. Either for some package that disappeared due to internal quarrels, or their cache being likely to server 502 depending on your AWS region, or some nodejs module that got updated and some code that used to depend on it can not load the newer version, …

Preventing such errors – or spotting them as soon as possible – is crucial, when your setup relies on disposable instances that should auto-configure themselves on boot.
Which brings us to our main topic: CircleCI. I’ve been discussing this service on a former post, CircleCI is an easy way to keep an eye on your GitHub repositories.
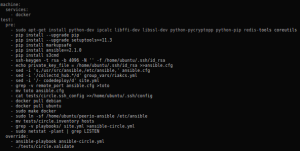
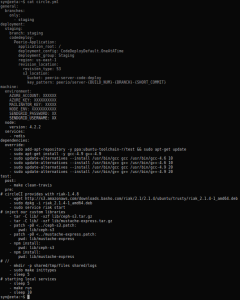
CircleCI configuration running Ansible

CircleCI configuration running Ansible

CircleCI default image is some Ubuntu Precise on steroids, pretty much everything that exists in official or popular repositories would be installed, you’ld be able to pick your NodeJS, Python, Ruby, … versions. And lately, I’ve noticed that we’re even able to use Docker.

As usual, a very short circle.yml is enough to get us started.
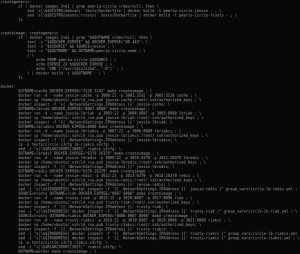
Makefile rules spawning docker containers

Makefile rules spawning docker containers

Note that our docker containers are started from a Makefile, which makes it easier to use colons, mapping internal to external ports (colons being a Yaml delimiter).

We also add our own ~/.ssh/config, so our Ansible inventory can refer to hostnames instead of several occurrences of 127.0.0.1 with different client ports. Somehow, the latter seems to disturb Ansible.
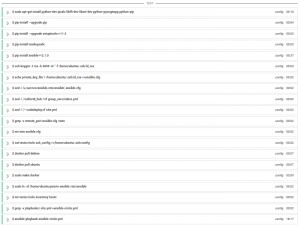
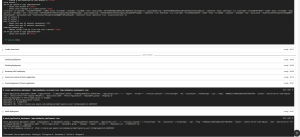
CircleCI applying our Ansible cuisine

CircleCI applying our Ansible cuisine

Our current configuration would start 9 instances, allowing us to apply our ansible roles against different configurations (riak node, redis node, loadbalancer, nodejs worker, …).

The whole process, from CircleCI instance start to our nine docker containers being configured, then running a few checks ensuring our services behave as expected, takes about 25 minutes. Bearing in mind CircleCI free plans usually won’t let you run your tests for more than 30 minutes.

Note that from time to time, installing your packages from httpredir.debian.org would end up in connections getting closed, and some of your images may fail building. I’m not sure yet how to address these.

I would also like to expose nagios & munin ports, having CircleCI running checks as our internal monitoring would have done. Still, we’re already running a few wgets, redis and s3cmd based verifications, making sure our main services are behaving as expected.


Now I should say I’m usually skeptical regarding Docker relevance, as I’m mostly dealing with production setups. I’ve been testing Docker a few times on laptops, without being much impressed – sure, the filesystem layers thing is kind of nice. Then again, I’m more likely to trust Xen’s para-virtualization these days.

It's so complex and cool!

It’s not stupid at all! Pinkerton, you explain the logic and I’ll provide the background

Eventually, I ended up installing Docker on some KVM guest I use building Debian & Ubuntu source packages.
Running Docker on CircleCI felt like an obvious thing to do – and you probably already have heard of someone using Docker in conjunction with Jenkins or whatever CI chain.
I wouldn’t recommend nesting virtualization technologies, although this may be one of the rare cases such practice won’t potentially hurt your production, while helping you in ensuring your deployment cuisine actually does what you’re expecting of it, whatever service you would be deploying.
Reweighting Ceph

For those familiar with the earlier versions of Ceph, you may be familiar with that process, as objects were not necessarily evenly distributed across the storage nodes of your cluster. Nowadays, and since somewhere around Firefly and Hammer, the default placement algorithm is way more effective on that matter.

Still, after a year running what started as a five hosts/three MONs/18 OSDs cluster, and grew up to eight hosts and 29 OSDs, two of them out – pending replacement – it finally happened, one of my disks usage went up to over 90%:

Ceph disks usage, before reweight

Ceph disks usage, before reweight

/dev/sdd1 442G 202G 241G 46% /var/lib/ceph/osd/ceph-24
/dev/sdb1 3.7T 2.7T 982G 74% /var/lib/ceph/osd/ceph-22
/dev/sdc1 1.9T 1.7T 174G 91% /var/lib/ceph/osd/ceph-23
/dev/sde1 3.7T 2.7T 1002G 74% /var/lib/ceph/osd/ceph-7
/dev/sdc1 3.7T 2.5T 1.2T 69% /var/lib/ceph/osd/ceph-5
/dev/sdb1 472G 67M 472G 1% /var/lib/ceph/osd/ceph-4
/dev/sdd1 3.7T 73M 3.7T 1% /var/lib/ceph/osd/ceph-6
/dev/sdc1 1.9T 1.2T 718G 62% /var/lib/ceph/osd/ceph-20
/dev/sdb1 2.8T 2.0T 778G 73% /var/lib/ceph/osd/ceph-19
/dev/sda1 442G 183G 260G 42% /var/lib/ceph/osd/ceph-18
/dev/sdd1 2.8T 2.0T 749G 74% /var/lib/ceph/osd/ceph-21
/dev/sdc1 927G 493G 434G 54% /var/lib/ceph/osd/ceph-17
/dev/sda1 1.9T 1.2T 717G 62% /var/lib/ceph/osd/ceph-15
/dev/sdb1 927G 519G 408G 56% /var/lib/ceph/osd/ceph-16
/dev/sda1 461G 324G 137G 71% /var/lib/ceph/osd/ceph-8
/dev/sdb1 3.7T 2.8T 953G 75% /var/lib/ceph/osd/ceph-9
/dev/sdc1 3.7T 2.2T 1.5T 61% /var/lib/ceph/osd/ceph-10
/dev/sdd1 2.8T 1.7T 1.1T 62% /var/lib/ceph/osd/ceph-11
/dev/sdd1 3.7T 2.1T 1.6T 57% /var/lib/ceph/osd/ceph-3
/dev/sdb1 3.7T 1.9T 1.9T 51% /var/lib/ceph/osd/ceph-1
/dev/sda1 472G 306G 166G 65% /var/lib/ceph/osd/ceph-0
/dev/sdc1 3.7T 2.5T 1.2T 68% /var/lib/ceph/osd/ceph-2
/dev/sda1 461G 219G 242G 48% /var/lib/ceph/osd/ceph-25
/dev/sdb1 2.8T 1.7T 1.1T 61% /var/lib/ceph/osd/ceph-26
/dev/sdc1 3.7T 2.5T 1.2T 68% /var/lib/ceph/osd/ceph-27
/dev/sdd1 2.8T 1.5T 1.3T 55% /var/lib/ceph/osd/ceph-28
/dev/sdc1 927G 696G 231G 76% /var/lib/ceph/osd/ceph-14
/dev/sda1 1.9T 1.1T 798G 58% /var/lib/ceph/osd/ceph-12
/dev/sdb1 2.8T 2.0T 804G 72% /var/lib/ceph/osd/ceph-13

It was time to do something:

ceph:~# ceph osd reweight-by-utilization
SUCCESSFUL reweight-by-utilization: average 0.653007, overload 0.783608. reweighted: osd.23 [1.000000 -> 0.720123]

about two hours later, all fixed:

Ceph disks usage, after reweight

Ceph disks usage, after reweight

/dev/sdd1 442G 202G 241G 46% /var/lib/ceph/osd/ceph-24
/dev/sdb1 3.7T 2.8T 904G 76% /var/lib/ceph/osd/ceph-22
/dev/sdc1 1.9T 1.2T 638G 66% /var/lib/ceph/osd/ceph-23
/dev/sde1 3.7T 2.7T 976G 74% /var/lib/ceph/osd/ceph-7
/dev/sdc1 3.7T 2.5T 1.2T 69% /var/lib/ceph/osd/ceph-5
/dev/sdb1 472G 69M 472G 1% /var/lib/ceph/osd/ceph-4
/dev/sdd1 3.7T 75M 3.7T 1% /var/lib/ceph/osd/ceph-6
/dev/sdc1 1.9T 1.2T 666G 65% /var/lib/ceph/osd/ceph-20
/dev/sdb1 2.8T 2.0T 830G 71% /var/lib/ceph/osd/ceph-19
/dev/sda1 442G 183G 260G 42% /var/lib/ceph/osd/ceph-18
/dev/sdd1 2.8T 2.1T 696G 76% /var/lib/ceph/osd/ceph-21
/dev/sdc1 927G 518G 409G 56% /var/lib/ceph/osd/ceph-17
/dev/sda1 1.9T 1.2T 717G 62% /var/lib/ceph/osd/ceph-15
/dev/sdb1 927G 519G 408G 56% /var/lib/ceph/osd/ceph-16
/dev/sda1 461G 324G 137G 71% /var/lib/ceph/osd/ceph-8
/dev/sdb1 3.7T 2.8T 928G 76% /var/lib/ceph/osd/ceph-9
/dev/sdc1 3.7T 2.3T 1.4T 62% /var/lib/ceph/osd/ceph-10
/dev/sdd1 2.8T 1.7T 1.1T 62% /var/lib/ceph/osd/ceph-11
/dev/sdd1 3.7T 2.2T 1.5T 60% /var/lib/ceph/osd/ceph-3
/dev/sdb1 3.7T 1.9T 1.9T 51% /var/lib/ceph/osd/ceph-1
/dev/sda1 472G 306G 166G 65% /var/lib/ceph/osd/ceph-0
/dev/sdc1 3.7T 2.5T 1.2T 69% /var/lib/ceph/osd/ceph-2
/dev/sda1 461G 219G 242G 48% /var/lib/ceph/osd/ceph-25
/dev/sdb1 2.8T 1.7T 1.1T 62% /var/lib/ceph/osd/ceph-26
/dev/sdc1 3.7T 2.5T 1.2T 69% /var/lib/ceph/osd/ceph-27
/dev/sdd1 2.8T 1.6T 1.3T 56% /var/lib/ceph/osd/ceph-28
/dev/sdc1 927G 696G 231G 76% /var/lib/ceph/osd/ceph-14
/dev/sda1 1.9T 1.1T 798G 58% /var/lib/ceph/osd/ceph-12
/dev/sdb1 2.8T 2.0T 804G 72% /var/lib/ceph/osd/ceph-13

one year of ceph

one year of ceph

I can’t speak for IO-intensive cases, although as far as I’ve seen the process of reweighting an OSD or repairing damaged placement groups blends pretty well with my usual workload.
Then again, Ceph provides with ways to priorize operations (such as backfill or recovery), allowing you to fine tune your cluster, using commands such as:

# ceph tell osd.* injectargs ‘–osd-max-backfills 1’
# ceph tell osd.* injectargs ‘–osd-max-recovery-threads 1’
# ceph tell osd.* injectargs ‘–osd-recovery-op-priority 1’
# ceph tell osd.* injectargs ‘–osd-client-op-priority 63’
# ceph tell osd.* injectargs ‘–osd-recovery-max-active 1’

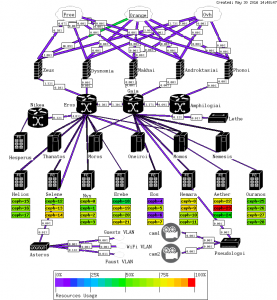
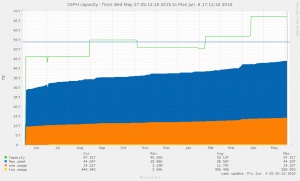
While on the subject, last screenshot to celebrate one year running Ceph and OpenNebula, illustrating how much crap I can hoard.

Woozweb, Uptime Robot, StatusCake

Today, a post on a service that closed today, and investigating on potential replacements.

woozweb

woozweb

In the last few years, I worked for Smile, a french Open Source integrator. Among other things, Smile hosted Woozweb, a free service allowing you to define HTTP checks, firing mail notifications.

Since I left Smile, I’ve opened an account on Woozweb, and used it looking after public services I manage, checking them from outside my facilities.
Two days ago, I received a mail from some Smile’s manager, notifying me that Woozweb would be shut down on May 13th. As of writing these lines (around 4 am), the site is indeed closed.

Such sites may seem stupid, or incomplete. And sure, the service those provide is really limited.
Yet when your monitoring setup is located in the same vLAN, or some network connected to the service you are monitoring, you should keep in mind your view on this service is not necessarily what your remote users would experience with. Hence, third-party services could stumble upon failures your own setup won’t even suspect.

Now Woozweb wasn’t perfect. Outdated web interface, outdated nagios probes (that failed establishing ssl handshake against my tlsv1.1/tlsv1.2 only services), 10 checks limitation, never got a response from their support, … But it did the job, allowed string matches, graphed response times, used to warn me when those reached a threshold, …

uptimeRobot

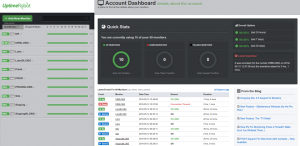
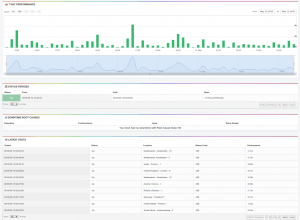
Uptime Robot dashboard

In the last couple days, I’ve been trying out alternatives to their service. There’s quite a lot of them, such as Pingdom. We’ll focus on free services, allowing https checks and triggering mail notifications.

The first I did test and could recommend is Uptime Robot.

Their interface is pretty nice and original. Service is free as long as you can stick to 50 checks with a 5 minutes interval, don’t need SMS notifications and can bear with 2 months of logs retention.

uptimeRobot

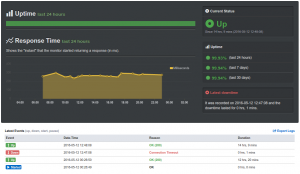
Uptime Robot check view

Defining checks is relatively easy, first results show up pretty quickly, no trouble checking tlsv1.1/tlsv1.2-only services. Already received an alert for a 1 minute outage, that my Icinga setup also warned me about.

Compared to Woozweb, the features are slightly better, whereas the web interface is definitely more pleasant. Yet there is no data regarding where those queries were issued from, and their paid plan page doesn’t mention geo-based checks – which is usually the kind of criteria we could look for, relying on such services.

StatusCake

StatusCake dashboard

Not being completely satisfied, I looked for an other candidate and ended up trying out StatusCake.

Again, their site is pretty agreeable. Those used to CircleCI would recognize the navigation bar and support button. Free plan includes an unlimited amount of checks, as long as 5 minutes granularity is enough, and does involve running checks from random locations – whereas paid plans would allow you to pick from “60+” locations (according to their pricing page, while their site also tells about servers in over 30 countries and 100 locations around the world).

StatusCake

StatusCake check view

Defining checks is pretty easy. I liked the idea of being forced to define a contact group – which would allow you to change the list of recipient alerts should be send to, for several checks at once. Yet the feature that definitely convinced me with Slack integration.
So even if you do not want to pay for a plan including SMS notifications, you could receive notifications on your phone using Slack.
Everything’s not perfect though: string matches are only allowed using paid plans. This kind of feature is pretty basic, … On the bright side, status-code based filtering is nicely done.

The check view confirms your service is monitored from various locations. It is maybe a little less appealing than Uptime Robot, but the Slack integration beats everything.

Another big advantage StatusCake has is their “Public Reporting” capabilities. I’m not sure I would use it right now, as I already wrote a small shell-script based website, serving as public reporting dashboard, that I host outside of our production setup.

Bearing in mind these service won’t exempt you from setting up some in-depth and exhaustive monitoring of your resources, they still are a nice addition. Sexy dashboards definitely help – I wouldn’t have shown Woozweb screenshots, as their UI was amazingly despicable.
I’ll probably keep using both Uptime Robot and StatusCake.

DMARC

Today we will discuss DMARC, a relatively new standard, considering the aging protocol it applies to.

DMARC stands for Domain-based Message Authentication Reporting and Conformance. It relies on a couple older standards: DKIM (discussed here) and SPF. Having properly configured both, setting up DMARC is just a formality.

DMARC can be used to audit your mail system, getting reports on who sends messages and where are they sent from. Although DMARC’s main purpose is more likely to address phishing. Then again, as for DKIM or SPF, DMARC’s effectiveness is strongly bound to its adoption.

DMARC relies on a TXT record, defining a policy for your domain (not to be confused with SPF), which would ultimately instruct remote SMTP servers on how to treat messages not matching “sender alignment” (the From field of your envelope, the From field of your headers and your DKIM signature must match). Additionally, you could also request for reports to be send back to some third-party mailbox.

Our TXT record would be a semicolon-separated concatenation of “tags”. The first couple tags being mandatory, and several others optional:

  • v is the (required) protocol version, usually v=DMARC1
  • p is the (required) policy for your domain, can be p=reject, p=none or p=quarantine
  • sp is the policy that should be applied for messages sent by sub-domains of the zone you are configuring. Defaults to your global (p) policy, although you may not want it so (p=quarantine;sp=reject)
  • rua is the address where aggregate DMARC reports should be sent to, would look like rua=mailto:admins@example.com, note that if the report receiver’s mailbox is not served within the domain you are defining this DMARC tag in, there is some additional DNS record to defined on the receiver’s end
  • ruf is the (optional) address where forensic DMARC reports should be sent to, works pretty much as rua does
  • rf is the format for failure reports. Defaults to AFRF (rf=afrf) which is defined by RFC5965, can be set to IODEF (rf=iodef) which is defined by RFC5070.
  • ri is the amount of seconds to wait between sending aggregate reports. Defaults to 86400 (ri=86400), sending a report per day.
  • fo instruct the receiving MTA on what kind of reports are expected from the sender’s side. Defaults to 0 (fo=0) which triggers a report if both DKIM and SPF checks fail. Can be a set to a 1 (fo=1), sending reports if any of DKIM and SPF checks fail. Can be set to d (fo=d) to send reports if DKIM check failed or s (fo=s) if SPF check failed. May be set to a colon-separated concatenation of values (fo=d:s).
  • pct is the percentage of messages that should be processed according to your DMARC policy, can be used to gradually adopt DMARC. Defaults to 100 (pct=100)
  • adkim defines how to check for sender alignment. Defaults to relaxed (adkim=r), meaning that as long as your sender address’s domain matches the DKIM domain, or any of its sub-domain, your message will match. Can be set to strict (adkim=s), to ensure your sender’s domain is an exact match for your DKIM signature.
  • aspf defaults to relaxed (aspf=r) which allows you to use distinct sub-domain, setting the From field of your envelope and your headers. Can be set to strict (aspf=s) ensuring these match.

In most cases, the defaults would suit you. Better define reporting address though, and make sure you’ll receive alerts for both SPF and DKIM errors. A minimalist record would look like:

$ORIGIN example.com.
_dmarc TXT "v=DMARC1;p=quarantine;fo=1;rua=mailto:monitoring@example.com;ruf=mailto:admins@example.com"

Ultimately, you may want to drop unexpected sub-domain communications as well:
$ORIGIN example.com.
_dmarc TXT "v=DMARC1;p=quarantine;sp=drop;adkim=s;aspf=s;fo=1;rua=mailto:monitoring@example.com;ruf=mailto:admins@example.com"

Note that in their support, Google recommends slow adoption.

Slack

slack global view

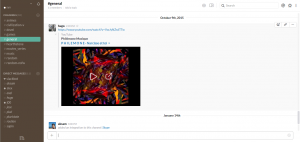
slack global view

As promised in a previous post, here is a long due introduction of Slack and its wonders.

On paper, Slack is a messaging solution built to ease up communication between team members. In addition to their main dashboard, as shown on the right, you will find Android and iOS applications, that would allow you to always stay in touch with your team.

As far as I’ve seen, you may create as much channels as you want. Users may pick the channels they want to subscribe to, and would be invited to join if their name is mentioned in channels they’re not listening to already.

Notifications are based on your being here. If you do allow desktop notifications on your browser, you may get notified when someone talks about you. Or you may define filters, if you want to track specific words, or a whole channel. You may configure different notification schemes on your browser and phone, … The whole thing is pretty well thought, and realized.

Slack Snippet

Slack Snippet

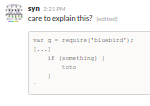
Slack Code Block

Slack Code Block

One can easily insert short code blocks into conversations. Or large blocks may be uploaded as snippets, that can be expanded, reviewed separately or comment upon.

An other key of Slack is the considerable amount of integrations. Among them: Google Hangouts, Skype, GitHub, CircleCI, or the “WebHook” (allowing you to post your notifications to an URL).

slack codedeploy

slack codedeploy

There’s no definite use case for Slack. I’ve been using it with coworkers I never met with, and with a bunch of friends I went to school with. Whereas one of these friends also uses it with coworkers he daily sees.

slack notifications

slack notifications

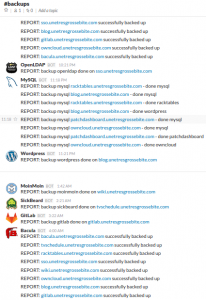
Even if code is not your concern, or if you’re alone and want to reduce the amount of SPAM your scheduled jobs may generate: Slack can be interesting. Running backups, monitoring deployments, or even receiving notifications from some monitoring system, Slack is a powerful tool that may just change your life.

The only negative observation I could make is that, from time to time, I get disconnected from all my groups. I get reconnected automatically, usually in less than a minute. Although sometimes, I’m really locked out, I can’t connect to any of my groups via my Orange fiber. In the meantime, I can see that other services in AWS’s us-east-1 are unreachable (such as a pair of HAproxy I have – which I may reach through CloudFlare, which acts as a frontend for my proxies). No problem from my phone, switching the WiFi off, using Free. I guess there’s some peering issues, which, sadly, occurs almost daily.

CircleCI

CircleCI logo

A few months ago, starting a job for a client I never worked with before, I was asked to write unit tests to familiarize myself with their product, and find a way to run these tests whenever a coworker would push his changes to GitHub. Testing our code requires a blank Riak database and a blank Redis server. Back then, I looked at several solutions such as Jenkins or TeamCity, in combination with Docker. Although I also considered services such as Travis and the one we’ll focus on today: CircleCI.

I didn’t knew of Travis and CircleCI before looking into running my own unit tests, which is a shame. Both service will provide you with free virtual machines within EC2, running unit tests according to some yaml file, describing how to setup your environment and validate your code works. The main difference between relies in billing.
Circle is free as long as you only run one build job at a time. You may pay to run concurrent jobs.
Travis is always free for opensource projects – as long as your repository is publicly available. You may pay to run tests against private repositories or to run concurrent jobs.
The big advantage behind such services is that you may easily install, configure and run dependencies your test will require. Setting up Postgres, MySQL, Redis or Riak databases, set a version for NodeJS, Go, PHP, python, …. And they provide with ways of testing Android and iOS applications as well.
Both will Circle and Travis will run your test from private VMs by default, although both would allow you to eventually enable SSH and forward some port/ip combination to your instance, so you may troubleshoot your tests while they’re running.
In terms of GUI, both services offer with a clean and relatively-lightweight way to track your jobs as they’re running. Back when I had to choose, CircleCI GUI was performing better on my old laptop, hence I can’t tell much more about Travis.
Both are integrated to GitHub, and will allow you to enable running automated tests on a per-repository basis, as well as pick the branches you need to build (or ignore).

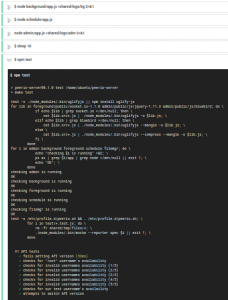
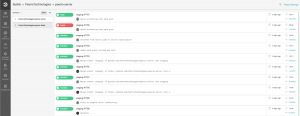
Tracking Tests on CircleCI

Tracking Tests on CircleCI

The first thing you need, running automated unit tests, is your unit tests. In my case, the project is a nodejs-based webservice. API documentation is pretty straight forward. I started with a small set of checks (is the service responding, does it fail when I try to call commands without authenticating?). Over the next days, I was able to check all our API calls, making sure our documentation was correct, and that error code were consistent when feeding these calls with incorrect arguments. Depending on your project, you may not need to get into this much trouble.

circle.yml

circle.yml

Having your unit tests ready, the next thing you need is a Makefile, or set of script that would initialize your databases (if applicable), install your nodejs/ruby/python/php dependencies (if applicable), … you should be able to easily run every step required, having fetched the last revision of your repository, to run your service.

Now that you can easily start and run tests against your service, you may focus on configuring CircleCI creating a circle.yml, at the root of your repository. In there, you will tell CircleCI what it needs to do to run your tests. Consider the base system is a Ubuntu 12.04 (precise), and may be changed to 14.04 (trusty). You may define environment variables, enable pre-installed services, install what could be missing. Your commands are issued as the ubuntu user, although you have unrestricted access to sudo. There’s much to say, feel free to give a look at their documentation.

circle jobs

circle jobs

Having figured out a way to properly run your tests, and granted that your set of tests is “exhaustive enough”, then you will be able to spot mistakes in the next few minutes of their being pushed.

Moreover, for those familiar with Slack: you easily setup notifications. — and the others should definitely look into Slack, I’ll probably post something soon about it, as I was able to get rid of lots of mail and SMS spam, sending my notifications (cron or nagios) there, and still getting notifications on my phone using their Android app: even if you do not work with teammates, Slack can make sense.

Back on Circle, last but not least, having successfully passed your tests, those of you using CodeDeploy (something else I should write a post about) may trigger a deployment, achieving both Continuous Integration and Continuous Delivery.

Slack Integration

Slack Integration

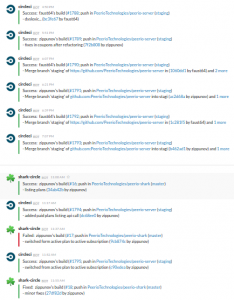
The screenshot on the right shows our Slack thread: our team ends up deploying several times a day, errors are spotted as they are pushed to GitHub, whereas the one on the left shows the end of a successful test, that ended up in pushing code to our staging setup.

circle unit tests done

circle unit tests done

To conclude, I had my first experiences with CI & CD about 8 months ago, and was not completely sold on the idea to begin with. I always assume that when I push code, I did test it, and so did my colleagues. Although Continuous Integration definitely helped, in forcing our whole team spotting and quickly fixing whatever mistake someone would have pushed. And at some extent, it sometimes leads me to push “theoretical” patches without even testing them, knowing CircleCI would eventually yell at me, …

Netdata

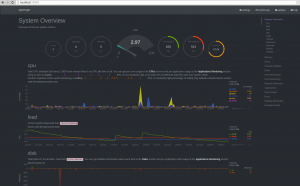
Netdata Dashboad

Netdata Dashboard

Lately, a friend advised me to give a look to Netdata. On paper, a lightweight dashboard, written in C, providing with realtime performances monitoring of Linux servers. Demo available here and there.

Having read the repository readme and installation instructions, the next thing I did to familiarize myself with Netdata, is to review the currently opened issues and pull requests. I can see FreeBSD is being investigated upon, packages are on their way, security concerns (such as Netdata default listen address) are being addressed, … Netdata may not be completely ready, yet it’s safe enough to be run pretty much everywhere, and definitely worth giving it a shot.

The setup process is pretty easy. You’ll pull a few dependencies – the kind you may not want on a production server though. A shell script will then build and install everything. A debian package skeleton is already there, if you prefer distributing binaries. Note that so far, you will have to register netdata service yourself, although their repository already includesboth systemd and initd samples.
As of right now, Netdata default behavior would be to listen on all your interfaces.

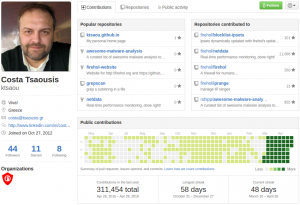
Netdata Author profile on Github

Netdata Author profile on Github

One last detail that caught my eye is that issue, enlightening the kind of guy we’re dealing with.
And I should probably also mention his GitHub profile, with the most amazing stats you’ll ever see, showing the kind of activity there’s been around Netdata lately.

One thing Netdata does not intend to provide is everlasting histories, nor even metrics aggregation. A couple issues tell about collectd or statsd potential integrations. Although Netdata intends to perform with very little overhead (contrarily to tools such as Collectd, which may increase your disk IOs) while displaying instantaneous values as and when they are read (contrarily to tools such as Munin, which won’t pull metrics faster than one dot per minute, and may need additional time generating its graphs).

Netdata probably won’t replace any of your existing service watching over your system metrics, yet it is indubitably powerful, pretty well written, while offering an exhaustive view over your system.

RiakCS

In the last few months, I’ve been working with some application using Riak as its main database.
Riak (being renamed as RiakKV) is a Key/Value NoSGBD, running on Debian Wheezy, Ubuntu Trusty, CentOS 7, FreeBSD 10, Solaris 10, SmartOS 13.1 and Fedora 17. Probably not the most famous of them, yet pretty powerful and pretty easy to manage and scale.

The main culprits I have to mention here, is that the opensource version is limited in terms of features, and won’t allow you to setup replication across several clusters. An other one is that data sharding is not necessarily guaranteed. You should also note that there’s some poor SEO on their documentation, which ends up in google searches pointing to broken links half of the time. Finally: lack of packaging for recent distributions, and according to their pro support: Jessie and Xenial package won’t show up before their 2.3, which is probably not for this year. Sure, it looks bad, and yet, it does the job.

Recommended setup involves 5 instances, according to Basho. Using default settings, you will always keep 3 copies of each data. You may theoretically lose two instances, before meeting with inconsistencies – which should resolve themselves, recovering your nodes. Consider that depending on the way you’ll use Riak, you could either end up with good or catastrophic consistency.

Anyway, that’s not our topic today. Now that we introduced Riak, I recently discovered that I could build some s3 capable service on top of it.
Building a cluster, you will install RiakKV to all your nodes. Your blobs will be stored in there.
RiakCS will also be installed to all your nodes. These are your s3 gateways. All your storage node are also gateways. You should consider setting up some haproxy forwarding http or https traffic to your RiakCS daemon.
Finally, you will install Stanchion (manager ensuring uniqueness of entities) to a single instance. Actually, you could install it to several instances, although you should have all your RiakCS services coordinating with a single Stanchion at a time.
Optionally, you could also install RiakCS Control, a user management interface.
All of these are OpenSource. You could still use a RiakKV license, synchronizing your dataset to a remote location, although this may not be necessary.
Basho documentation tells about RiakCS differences with Swift and Atmos, although you could also compare it to Sheepdog, Ceph used with Rados Gateways, or just AWS’s s3. On top of architectural specifics, you should also consider that each of these solution have its own limited implementation of the s3 API.

Having run a Ceph (infernalis) +Rados-gw cluster alongside a RiakCS cluster as EC2’s autoscale groups, I noted that Ceph OSD tend to crash. Running from an ASG, they get replaced by a new instance, previous one is destroyed, I haven’t investigated much on the specifics – running Ceph on virtual systems is not recommended anyway. Whereas RiakCS never troubled me.

Short parenthesis regarding s3 implementations: running Ceph, I wasn’t able to create a bucket using s3cmd. I ended up writing a python script, using boto. Whereas running RiakCS, I couldn’t run anything until I updated my .s3cfg to explicitly enable v2_signature: AWS now uses v4, which is not implemented by RiakCS (and not documented anywhere).

I would probably still recommend Ceph to most users running on physical hardware. Although for anyone less likely to succeed in building and running his Ceph cluster, I would definitely recommend RiakCS, where adding, removing or replacing nodes is ridiculously easy, while recoveries are relatively well documented – and rarely required anyway.