OpenShift 4 – Baremetal Deployment
Once again, quick post regarding OpenShift, today experimenting with the new installer, and OpenShift 4.
First, let’s remind ourselves that OKD 4 has not yet been released. I would be using my RedHat account credentials pulling images. I usually refuse to touch anything that is not strictly open source (and freely distributed), though I would make an exception here, as I’ve been waiting for OpenShift 4 for almost a year now. Back when my first OpenShift PR got refused, due to their focus being on OpenShift 4, … Now I’m visiting customers for OpenShift 4, I need my own lab to experiment with.
Prepare Hardware
Dealing with a baremetal deployment, we would need to prepare a subnet with its DHCP and PXE servers, a pair of LoadBalancers, and several instances for OpenShift itself.
The following would assume a VLAN was created, we would provide with isc-dhcp-server, tftpd-hpa, bind/nsd and haproxy configuration snippets.
OpenShift nodes would include a bootstrap node (only required during deployment, would be shut down afterwards), three master nodes, and as much worker nodes as we can allocate.
Bootstrap and master nodes should ship with 4 vCPU and 16G RAM at least, while workers could go with 2 vCPU and 8G RAM. Docs mention provisioning those node with at least 120G of disk storage, though this does not seem to be mandatory.
Those nodes would be running on top of KVM hypervisors.
Download Assets
We would start downloading a few assets out of RedHat cloud portal.
We would find links to RedHat CoreOS PXE sources – a kernel, an initramfs, and a pair of compressed filesystems that would be used installing CoreOS to our nodes. We would install those to our PXE server later.
We would also fetch a pull secret, that would allow us downloading images out of RedHat and Quay registries.
Finally, we would retrieve the latest oc client, as well as the openshift-install binaries.
DNS
Next, we would prepare DNS records for our OpenShift cluster and nodes.
Contrarily to OpenShift3, we would not be able to use customized names for the cluster API or its applications.
We would first create a zone for cluster host names, db.nodes.example.com:
$ORIGIN nodes.example.com.
bootstrap A 10.42.253.9
master1 A 10.42.253.10
master2 A 10.42.253.11
master3 A 10.42.253.12
infra1 A 10.42.253.13
infra2 A 10.42.253.14
infra3 A 10.42.253.15
compute1 A 10.42.253.20
compute2 A 10.42.253.21
compute3 A 10.42.253.22
compute4 A 10.42.253.23
compute5 A 10.42.253.24
haproxy1 A 10.42.253.150
haproxy2 A 10.42.253.151
Next, we would create a zone for the cluster itself, db.intra.example.com:
$ORIGIN intra.example.com.
api A 10.42.253.150
api A 10.42.253.151
api-int A 10.42.253.150
api-int A 10.42.253.151
*.apps A 10.42.253.150
*.apps A 10.42.253.151
etcd-0 A 10.42.253.10
etcd-1 A 10.42.253.11
etcd-2 A 10.42.253.12
_etcd-server-ssl._tcp 86400 IN SRV 0 10 2380 etcd-0.nodes.example.com.
_etcd-server-ssl._tcp 86400 IN SRV 0 10 2380 etcd-1.nodes.example.com.
_etcd-server-ssl._tcp 86400 IN SRV 0 10 2380 etcd-2.nodes.example.com.
And corresponding reverse records, in db.253.42.10.in-addr.arpa:
$ORIGIN 253.42.10.in-addr.arpa.
9 PTR bootstrap.nodes.example.com.
10 PTR master1.nodes.example.com.
11 PTR master2.nodes.example.com.
12 PTR master3.nodes.example.com.
13 PTR infra1.nodes.example.com.
14 PTR infra2.nodes.example.com.
15 PTR infra3.nodes.example.com.
20 PTR compute1.nodes.example.com.
21 PTR compute2.nodes.example.com.
22 PTR compute3.nodes.example.com.
23 PTR compute4.nodes.example.com.
24 PTR compute5.nodes.example.com.
150 PTR haproxy1.nodes.example.com.
151 PTR haproxy2.nodes.example.com.
Don’t forget to reload your zones before going further.
DHCP
Next, we would configure our DHCP server. First, we would setup static leases for our OpenShift nodes:
host bootstrap-eth0 {
hardware ethernet 52:54:00:e1:48:6a;
fixed-address 10.42.253.9;
}
host master0-eth0 {
hardware ethernet 52:54:00:be:c0:a4;
fixed-address 10.42.253.10;
}
host master1-eth0 {
hardware ethernet 52:54:00:79:f3:0f;
fixed-address 10.42.253.11;
}
host master2-eth0 {
hardware ethernet 52:54:00:69:74:8c;
fixed-address 10.42.253.12;
}
host infra1-eth0 {
hardware ethernet 52:54:00:d3:40:dc;
fixed-address 10.42.253.13;
}
host infra2-eth0 {
hardware ethernet 52:54:00:20:f0:af;
fixed-address 10.42.253.14;
}
host infra3-eth0 {
hardware ethernet 52:54:00:81:83:25;
fixed-address 10.42.253.15;
}
host compute1-eth0 {
hardware ethernet 52:54:00:48:77:48;
fixed-address 10.42.253.20;
}
host compute2-eth0 {
hardware ethernet 52:54:00:88:94:94;
fixed-address 10.42.253.20;
}
host compute3-eth0 {
hardware ethernet 52:54:00:ff:37:14;
fixed-address 10.42.253.20;
}
host compute4-eth0 {
hardware ethernet 52:54:00:c7:46:2d;
fixed-address 10.42.253.20;
}
host compute5-eth0 {
hardware ethernet 52:54:00:e1:60:5b;
fixed-address 10.42.253.20;
}
Next, we would setup a subnet for OpenShift nodes, enabling with PXE booting options:
subnet 10.42.253.0 netmask 255.255.255.0
{
option routers 10.42.253.1;
option domain-name “nodes.example.com intra.example.com”;
option domain-name-servers 10.42.253.3, 10.42.253.5;
filename “pxelinux.0”;
range 10.42.253.9 10.42.253.254;
next-server 10.42.44.100;
}
Don’t forget to restart your DHCP server.
Ignition
Now, we would generate some configurations to be served to PXE clients.
First, we would create a configuration file, mandatory for baremetal deployments, install-config.yaml:
apiVersion: v1
baseDomain: example.com
compute:
– hyperthreading: Enabled
name: worker
replicas: 0
controlPlane:
hyperthreading: Enabled
name: master
replicas: 3
metadata:
name: intra
networking:
clusterNetwork:
– cidr: 10.128.0.0/14
hostPrefix: 23
networkType: OpenShiftSDN
serviceNetwork:
– 172.30.0.0/16
platform:
none: {}
pullSecret: <pull-secret-from-cloud.openshift.com>
sshKey: ‘ssh-rsa <some-public-key-of-yours> admin@example.com’
If you haven’t already, extract the openshift-install binary from the archive downloaded out of RedHat cloud portal.
mkdir install-directory
cp -p install-config.yaml install-directory/
./openshift-install create manifests –dir=./install-directory
sed -i ‘s|mastersSchedulable:.*|mastersSchedulable: false|’ \
./install-directory/manifests/cluster-scheduler-02-config.yaml
./openshift-install create ignition-configs –dir=./install-directory/
scp -p install-directory/*.ign root@pxe-server:/srv/tftpboot/ocp4/
Note that the install-directory/auth subfolder includes a kubeconfig file, that can be used with the oc and kubectl clients, querying our cluster API, as well as kubeadmin default password logging into the cluster console.
PXE
Next, we would configure our PXE server booting RedHat CoreOS nodes.
wget -o /srv/tftpboot/ocp4/kernel \
https://mirror.openshift.com/pub/openshift-v4/dependencies/rhcos/4.2/4.2.0/rhcos-4.2.0-x86_64-installer-kernel
wget -o /srv/tftpboot/ocp4/initrd \
https://mirror.openshift.com/pub/openshift-v4/dependencies/rhcos/4.2/4.2.0/rhcos-4.2.0-x86_64-installer-initramfs.img
wget -o /srv/tftpboot/ocp4/metalbios.raw.gz \
https://mirror.openshift.com/pub/openshift-v4/dependencies/rhcos/4.2/4.2.0/rhcos-4.2.0-x86_64-metal-bios.raw.gz
cat <<EOF >/srv/tftproot/boot-screens/ocp4.cfg
menu title OCP4 RH-CoreOS Systems
menu title OCP4 RH-CoreOS Systems
menu label OCP4 RH-CoreOS Systems
menu exit
label –
menu label 4.2.0 x86_64 – bootstrap
kernel installers/ocp4-rhcos-4.2.0/x86_64/linux
append initrd=installers/ocp4-rhcos-4.2.0/x86_64/initrd-raw ip=dhcp rd.neednet=1 coreos.inst=yes coreos.inst.install_dev=vda coreos.inst.image_url=http://10.42.44.100/ocp4/rhcos-4.2.0-x86_64-metal-bios.raw.gz coreos.inst.ignition_url=http://10.42.44.100/ocp4/bootstrap.ign
label –
menu label 4.2.0 x86_64 – master
kernel installers/ocp4-rhcos-4.2.0/x86_64/linux
append initrd=installers/ocp4-rhcos-4.2.0/x86_64/initrd-raw ip=dhcp rd.neednet=1 coreos.inst=yes coreos.inst.install_dev=vda coreos.inst.image_url=http://10.42.44.100/ocp4/rhcos-4.2.0-x86_64-metal-bios.raw.gz coreos.inst.ignition_url=http://10.42.44.100/ocp4/master.ign
label –
menu label 4.2.0 x86_64 – worker
kernel installers/ocp4-rhcos-4.2.0/x86_64/linux
append initrd=installers/ocp4-rhcos-4.2.0/x86_64/initrd-raw ip=dhcp rd.neednet=1 coreos.inst=yes coreos.inst.install_dev=vda coreos.inst.image_url=http://10.42.44.100/ocp4/rhcos-4.2.0-x86_64-metal-bios.raw.gz coreos.inst.ignition_url=http://10.42.44.100/ocp4/worker.ign
menu end
EOF
Note that our PXE server also includes its HTTP server, hosting ignition configs and CoreOS installation image URL. In theory, all you need here is an HTTP server, not necessarily related to your PXE server.
Load Balancers
Before we can deploy OpenShift, we would setup its LoadBalancers. Here, we would use HAProxy, with the following configuration:
global
maxconn 20000
log /dev/log local0 info
chroot /var/lib/haproxy
pidfile /var/run/haproxy.pid
user haproxy
group haproxy
daemon
stats socket /var/lib/haproxy/statsdefaults
mode http
log global
option httplog
option dontlognull
option forwardfor except 127.0.0.0/8
option redispatch
retries 3
timeout http-request 10s
timeout queue 1m
timeout connect 10s
timeout client 300s
timeout server 300s
timeout http-keep-alive 10s
timeout check 10s
maxconn 20000listen stats
bind :9000
mode http
stats enable
stats uri /frontend k8s-api
bind *:6443
default_backend k8s-api
mode tcp
option tcplogbackend k8s-api
balance source
mode tcp
server bootstrap 10.42.253.9:6443 check
server master0 10.42.253.10:6443 check
server master1 10.42.253.11:6443 check
server master2 10.42.253.12:6443 checkfrontend machine-config-server
bind *:22623
default_backend machine-config-server
mode tcp
option tcplogbackend machine-config-server
balance source
mode tcp
server bootstrap 10.42.253.9:22623 check
server master0 10.42.253.10:22623 check
server master1 10.42.253.11:22623 check
server master2 10.42.253.12:22623 checkfrontend apps-tls
bind *:443
default_backend apps-tls
mode tcp
option tcplogbackend apps-tls
balance source
mode tcp
server router0 10.42.253.13:443 check
server router1 10.42.253.14:443 check
server router2 10.42.253.15:443 checkfrontend apps-clear
bind *:80
default_backend apps-clear
mode tcp
option tcplogbackend apps-clear
balance source
mode tcp
server router0 10.42.253.13:80 check
server router1 10.42.253.14:80 check
server router2 10.42.253.15:80 check
Don’t forget to start and enable HAProxy service.
Boot Instances
Now we should have everything we need. First boot the boostrap node using PXE, wait for it to reboot, then boot the three master nodes in PXE.
We would be able to SSH to each node, as the core user, using the SSH key passed to openshift-install earlier. Keep an eye on system logs.
Meanwhile, we could use openshift-install tracking for OpenShift API bootstrap completion:
./openshift-install –dir=./install-directory wait-for bootstrap-complete \
log-level info
Eventually, that command would exit, and should confirm our cluster API is now reachable. At that stage, the cluster is not yet done deploying, though we’re getting close.
Next, we would boot our infra nodes in PXE. Keep an eye on certificate signing requests, as we would need to approve those new nodes while joining the cluster:
oc get csr
oc adm certificate sign csr-xxx
Eventually, we should be able to confirm the cluster operators are finishing to deploy.
The only one that would stay in a degraded state would be the image registry operator. Here, we would need to define OpenShift integrated registry storage configuration:
oc edit configs.imageregistry.operator.openshift.io
To keep it simple, we would stick to an emptyDir storage (volatile), which is not usually recommended.
oc get co
NAME VERSION AVAILABLE PROGRESSING DEGRADED SINCE
authentication 4.2.0 True False False 1h36m
cloud-credential 4.2.0 True False False 2h
cluster-autoscaler 4.2.0 True False False 1h56m
console 4.2.0 True False False 1h37m
dns 4.2.0 True False False 2h
image-registry 4.2.0 True False False 49m
ingress 4.2.0 True False False 1h42m
insights 4.2.0 True False False 2h
kube-apiserver 4.2.0 True False False 1h59m
kube-controller-manager 4.2.0 True False False 1h58m
kube-scheduler 4.2.0 True False False 1h59m
machine-api 4.2.0 True False False 2h
machine-config 4.2.0 True False False 2h
marketplace 4.2.0 True False False 1h56m
monitoring 4.2.0 True False False 1h40m
network 4.2.0 True False False 2h
node-tuning 4.2.0 True False False 1h56m
openshift-apiserver 4.2.0 True False False 1h57m
openshift-controller-manager 4.2.0 True False False 1h59m
openshift-samples 4.2.0 True False False 1h55m
operator-lifecycle-manager 4.2.0 True False False 2h
operator-lifecycle-manager-catalog 4.2.0 True False False 2h
operator-lifecycle-manager-packageserver 4.2.0 True False False 1h58m
service-ca 4.2.0 True False False 2h
service-catalog-apiserver 4.2.0 True False False 1h56m
service-catalog-controller-manager 4.2.0 True False False 1h57m
storage 4.2.0 True False False 1h56m
Eventually, we may boot workers using PXE, until all nodes joined our cluster. We can also terminate the bootstrap node, that is no longer needed.
LDAP Authentication
Finally, we would setup LDAP authentication. By default, OpenShift4 ships with a single kubeadmin user, that could be used during initial cluster configuration.
oc –config ./kubeconfig create secret generic ldap-secret \
–from-literal=bindPassword=<secret> -n openshift-config
oc –config ./kubeconfig create configmap ldap-ca \
–from-file=ca.crt=/path/to/ldap-ca-chain.crt -n openshift-config
Having create a Secret with our OpenShift LDAP service account bind password, and a ConfigMap serving the CA chain, used to sign our OpenLDAP TLS certificate, we would then import the following OAuth configuration:
apiVersion: config.openshift.io/v1
kind: OAuth
metadata:
name: cluster
spec:
identityProviders:
– name: LDAP
mappingMethod: claim
type: LDAP
ldap:
attributes:
id:
– dn
email:
name:
– sn
preferredUsername:
– uid
bindDN: “cn=openshift,ou=services,dc=example,dc=com”
bindPassword:
name: ldap-secret
ca:
name: ldap-ca
insecure: false
url: “ldaps://netserv.vms.example.com/ou=users,dc=example,dc=com?uid?sub?(&(objectClass=inetOrgPerson)(!(pwdAccountLockedTime=*)))”
Having applied that configuration, we would see Pods from the openshift-authentication namespace rebooting. We would then be able to log in using an LDAP account.
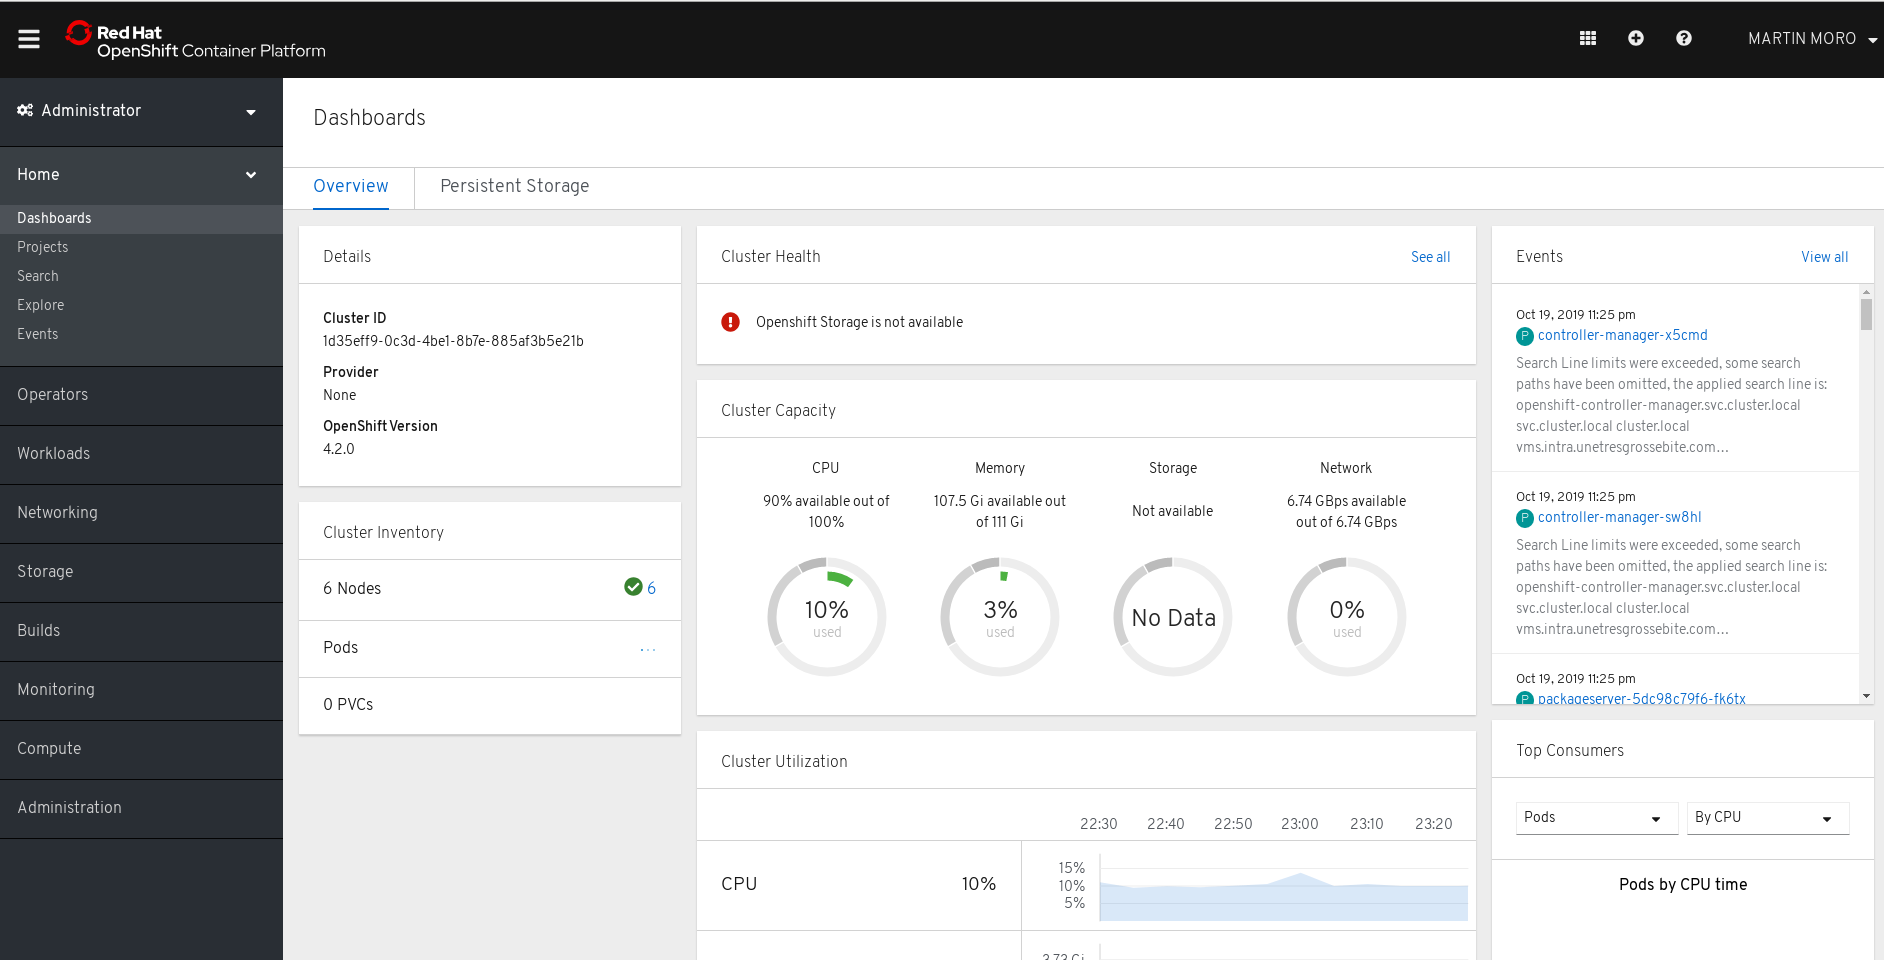
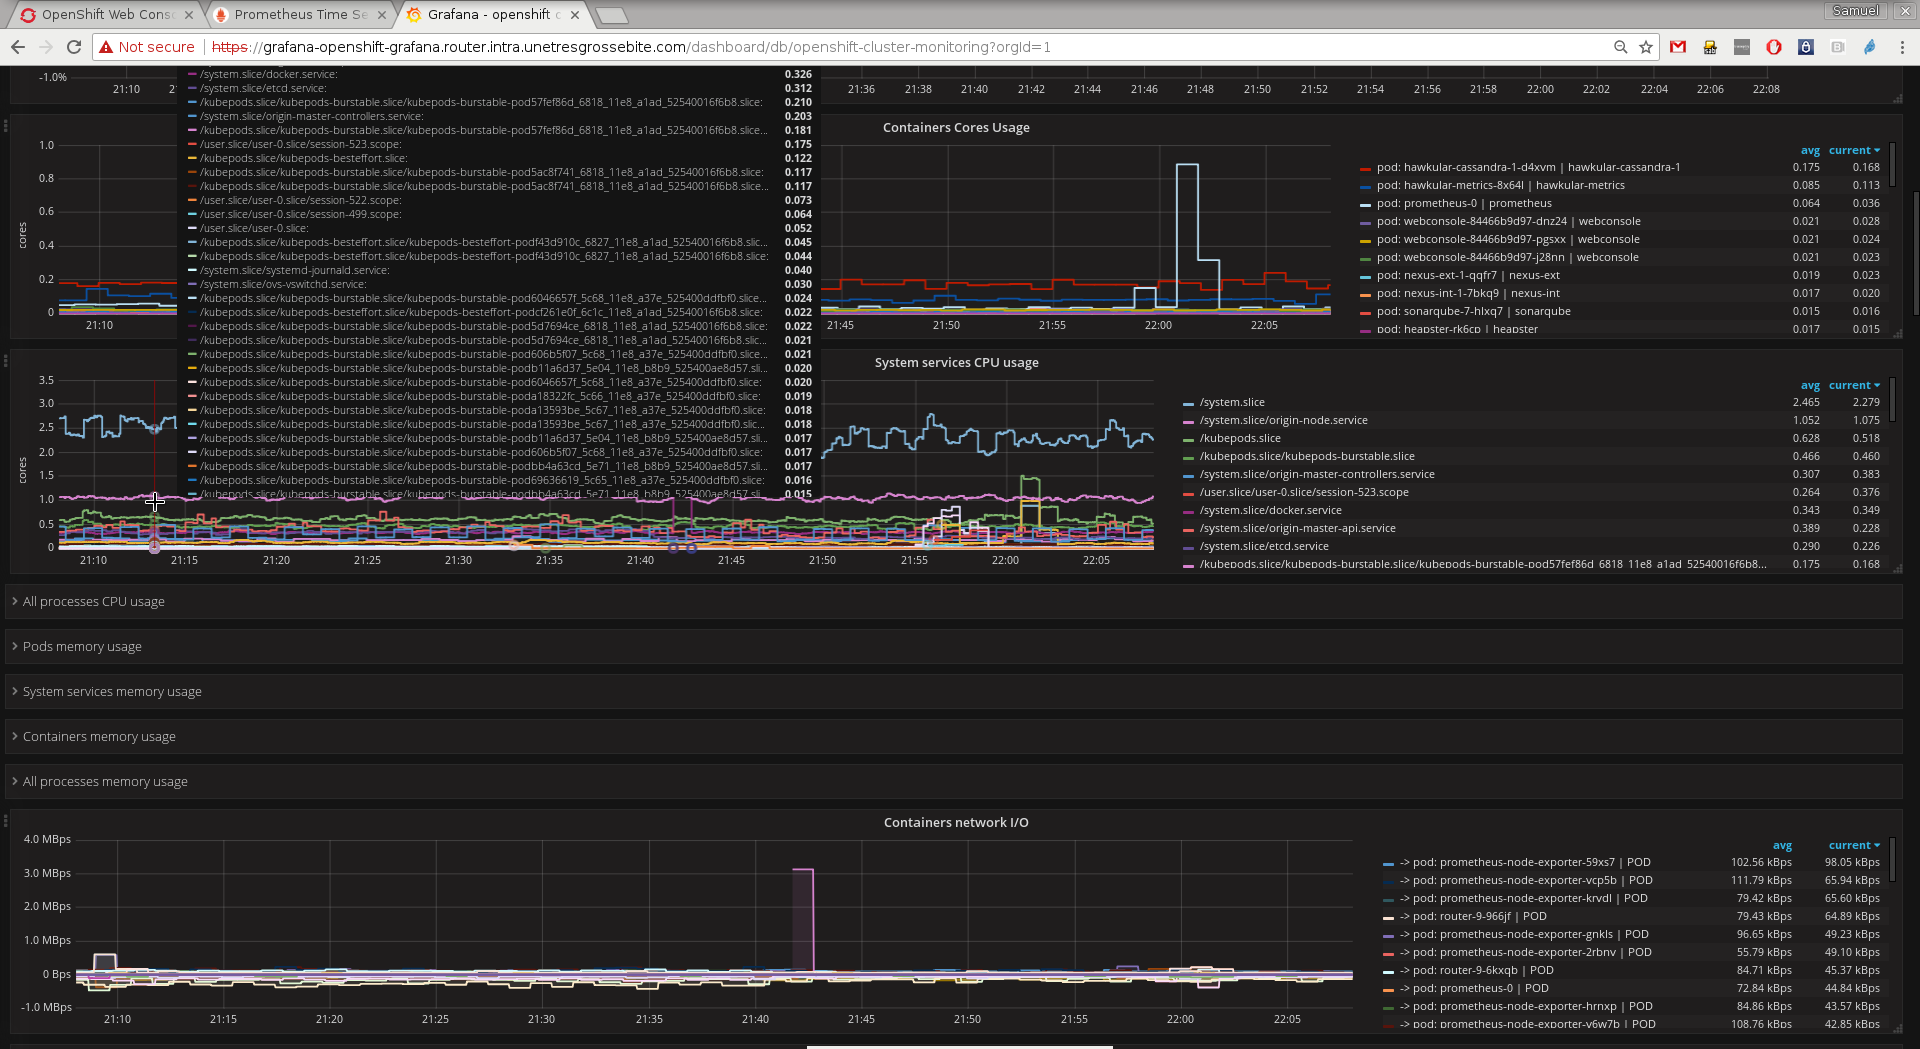
OpenShift4 Dashboard
Infra Nodes
Last detail: after deployment, an OpenShift 4 cluster would include master and worker nodes, while OpenShift 3 used to ship with master, infra and compute nodes.
The worker nodes in OpenShift 4 are meant to replace both infra and computes, which could make sense running smaller setups, though I would argue is not much practical scaling out. Having a small set of nodes, designated to host OpenShift ingress controllers is a good thing, as we only need to configure those IPs as backends for our applications loadbalancers. Say we only rely on worker nodes, every time we add new members to our cluster, we would also need reconfiguring our loadbalancer.
Hence, we would create a group of Infra machines, starting with creating a MachineConfigPool, using the following cofiguration:
apiVersion: machineconfiguration.openshift.io/v1
kind: MachineConfigPool
metadata:
name: infra
spec:
machineConfigSelector:
matchLabels:
machineconfiguration.openshift.io/role: infra
nodeSelector:
matchLabels:
node-role.kubernetes.io/infra: “”
paused: false
Having applied that configuration, we would then dump MachineConfig objects applying to worker nodes:
DUMP=$(oc get machineconfig | grep -v rendered | \
awk ‘/worker/{print $1}’ | tr ‘\n’ ‘ ‘)oc get machineconfig -o yaml $DUMP >machineconfig-infra.yaml
We would then edit machineconfig-infra.yaml content, removing “generated-by” annotations, creationTimestamps, generation, ownerReferences, resourceVersions, selfLink and uid metadata. Replace any remaning mention of “worker” by “infra”. Then apply the resulting objects:
oc apply -f machineconfig-infra.yaml
oc get mc
00-infra 2.2.0 1m
01-infra-container-runtime 2.2.0 1m
01-infra-kubelet 2.2.0 1m
99-infra-ad9f8790-f270-11e9-a34e-525400e1605b-registries 2.2.0 1m
99-infra-ssh 2.2.0 1m
At that stage, the MachineConfig Operator should be rendering a last MachineConfig object, including an exhaustive list of configurations for our infra nodes. Once oc get mc includes that rendered configuration, we would make sure the MachineConfig Operator is done with our MachineConfigPool and start re-labeling nodes accordingly:
oc get mcp
NAME CONFIG UPDATED UPDATING DEGRADED
infra rendered-infra-0506920a222781a19fff88a4196deef4 True False False
master rendered-master-747943425e64364488e51d15e5281265 True False False
worker rendered-worker-5e70256103cc4d0ce0162430de7233a1 True False False
oc label node infra1.nodes.example.com node-role.kubernetes.io/infra=
node/infra1.nodes.example.com labeled
oc label node infra1.nodes.example.com node-role.kubernetes.io/worker-
node/infra1.nodes.example.com labeled
From there, our node would be set unschedulable, drained, and rebooted. Our customized MachineConfig should have changed the role label applied when our node boots, which we may confirm once it is done restarting
oc get nodes
compute1.nodes.example.com Ready worker 47m v1.14.6+c07e432da
compute2.nodes.example.com Ready worker 45m v1.14.6+c07e432da
compute3.nodes.example.com Ready worker 34m v1.14.6+c07e432da
compute4.nodes.example.com Ready worker 33m v1.14.6+c07e432da
compute5.nodes.example.com Ready worker 31m v1.14.6+c07e432da
infra1.nodes.example.com Ready infra 2h v1.14.6+c07e432da
infra2.nodes.example.com Ready worker 2h v1.14.6+c07e432da
infra3.nodes.example.com Ready worker 2h v1.14.6+c07e432da
master1.nodes.example.com Ready master 2h v1.14.6+c07e432da
master2.nodes.example.com Ready master 2h v1.14.6+c07e432da
master3.nodes.example.com Ready master 2h v1.14.6+c07e432da
Once our node is back, we would proceed with the next infra node.
We would eventually reconfigure our Ingress Controller deploying OpenShift Routers back to our infra nodes:
oc edit -n openshift-ingress-operator ingresscontroller default
spec:
nodePlacement:
nodeSelector:
matchLabels:
node-role.kubernetes.io/infra: “”
replicas: 3
We would then keep track of routers Pods as they’re being re-deployed:
oc get pods -n openshift-ingress -o wide
NAME READY STATUS RESTARTS AGE IP NODE
router-default-86cdb97784-4d72k 1/1 Running 0 14m 10.42.253.14 infra2.nodes.example.com
router-default-86cdb97784-8f5vm 1/1 Running 0 14m 10.42.253.15 infra3.nodes.example.com
router-default-86cdb97784-bvvdc 1/1 Running 0 105s 10.42.253.13 infra1.nodes.example.com
Ceph RBD Storage
Later on, we may want to configure OpenShift interfacing with an existing Ceph cluster, setting up persisting volumes.
While OpenShift 3 used to ship with rbd binaries in the api controller image, while allowing for their installation on OpenShift nodes, this is no longer the case with OpenShift 4. Instead, we would rely on CSI (Container Storage Interface), which is meant to be a more generic interface.
Then, we would need to deploy Ceph CSI interface to OpenShift,
git clone https://github.com/ceph/ceph-csi/
oc new-project ceph-csi
for sa in rbd-csi-provisioner rbd-csi-nodeplugin; do
oc create sa $sa
oc adm policy add-scc-to-user hostaccess system:serviceaccount:ceph-csi:$sa
oc adm policy add-scc-to-user privileged system:serviceaccount:ceph-csi:$sa
done
cat ceph-csi/deploy/rbd/kubernetes/v1.14+/csi-*yaml | sed ‘s|namespace: default|namespace: ceph-csi|g’ | oc apply -n ceph-csi -f-
cat <<EOF >config.json
[
{
“clusterID”: “my-ceph-cluster-id”,
“monitors: [ “10.1.2.3”,”10.1.2.4″10.1.2.5″ ]
}
]
EOF
oc delete cm -n ceph-csi ceph-csi-config
oc create cm -n ceph-csi ceph-csi-config –from-file=config.json=./config.json
cat << EOF >secret.yaml
apiVersion: v1
kind: Secret
metadata:
name: ceph-rbd-secret
stringData:
userID: my-ceph-user-id
userKey: my-user-key
EOF
oc apply -n default -f secret.yaml
cat << EOF >storageclass.yaml
apiVersion: storage.k8s.io/v1
kind: StorageClass
metadata:
name: ceph-storage
provisioner: rbd.csi.ceph.com
parameters:
clusterID: my-ceph-cluster-id
pool: kube
imageFeatures: layering
csi.storage.k8s.io/provisioner-secret-name: csi-rbd-secret
csi.storage.k8s.io/provisioner-secret-namespace: default
csi.storage.k8s.io/node-stage-secret-name: csi-rbd-secret
csi.storage.k8s.io/node-stage-secret-namespace: default
csi.storage.k8s.io/fstype: xfs
reclaimPolicy: Delete
mountOptions:
– discard
EOF
oc apply -f storageclass.yaml
At that stage, we would have deployed a DaemonSet of csi-rbdplugin Pods, tasked with attaching and detaching volumes during Pods scheduling and terminations, as well as a Deployment of csi-rbdplugin-provisioner Pods, creating and purging volumes out of Ceph, while managing OpenShift Persistent Volumes.
At that stage, we may create a first Persistent Volume and redeploy OpenShift integrated registry on top of it:
cat <<EOF >registry-pvc.yaml
apiVersion: v1
kind: PersistentVolumeClaim
metadata:
name: image-registry
namespace: openshift-image-registry
spec:
accessModes:
– ReadWriteOnce
resources:
requests:
storage: 100Gi
EOF
oc apply -f registry-pvc.yaml
oc edit configs.imageregistry.operator.openshift.io
[…]
storage:
pvc:
claim: image-registry-storage
[…]
oc get pods -n openshift-image-registry -w
Conclusion
First thing I would regret is the disappearance of rbd binaries from controllers images. As a result, the Ceph provisioner we used to configure with OpenShift3 no longer works. Apparently, CSI provisioners would be recommended instead, though that implementation is kind of slower, and involves quite a lot of Pods.
After deployment, roughly 12G RAM and 4 CPUs are allocated to cluster operators and OpenShift internals.
Another concern may be that all those operators are privileged actors in our cluster. While we usually had to compromise a node to attack a cluster, now we have a lot of operators that might be accessed through the API, arguably expanding OpenShift attack surface.
The dashboard shows a total CPU capacity of “100%”, which is quite useless.
OpenShift 4.2 is based on Kubernetes 1.14. Among nother novelties, as compared with OpenShift 3, we could mention Istio reaching GA or Tekton pipelines.