About a year ago, I started writing some Ansible roles in order to bootstrap the various services involved in hosting Peerio backend.
Running on EC2, using Ansible was an easy way to quickly get my new instances up and running. Moreover, Ansible comes with a few plugins that would allow you to define Route53 records and health checks. Or could even be used creating EC2 Instances or Auto Scale Groups.
Using AWS’s contextualization (USER_DATA), I’m able to pass variables to my booting instances, so that each new machine pulls its copy of our ansible repository, generates a few yamls including “localization” variables (which redis, riak, … http cache should we be using). Then, the boot process applies our main ansible playbook, setting up whatever service was requested in our USER_DATA.
One could argue that running on EC2, I could have prepared distinct templates for each class of service. Which would imply having instances that boot faster. Although the counterpart is that I would need to manage more templates, may forget to update some file somewhere, … Whereas right now, I only need to maintain a couple AMIs (a Jessie image, for pretty much all our services, and a Trusty one, for Riak & RiakCS: despite paying for enterprise support, we’re still unable to get our hands on some package for Debian Jessie or Ubuntu Xenial).
An other advantage of being able to bootstrap our backend using Ansible, is that whenever we would want to assist customers in setting up their own cluster, we do already have reproducible recipes – with some relatively exhaustive documentation.
As of Puppet, Chef, … or any orchestration solution, Ansible is a very powerful tool coding your way through automation. But whenever you write some module, or end up forking and deploying some external project to your setup, you would be subject to potential failures, most of the time syntax errors related, maybe some poorly-set permission, …
Deploying instances, you’re either root or able to assume such privileges, restart a webserver, install packages, replace critical configurations on your systems, … Anything could happen, everything could break.
An other source of risks, in addition to self-authored pebkacs, is depending on external resources. Which could be apt packages, ruby gems, python packages, node modules, …. Even though we can usually trust our system’s official repositories to serve us with a consistent set of packages, whenever we assume we would be able to install some external dependency at boot time, when you need your service to be available already: we are placing a bet, and time would eventually prove us wrong.
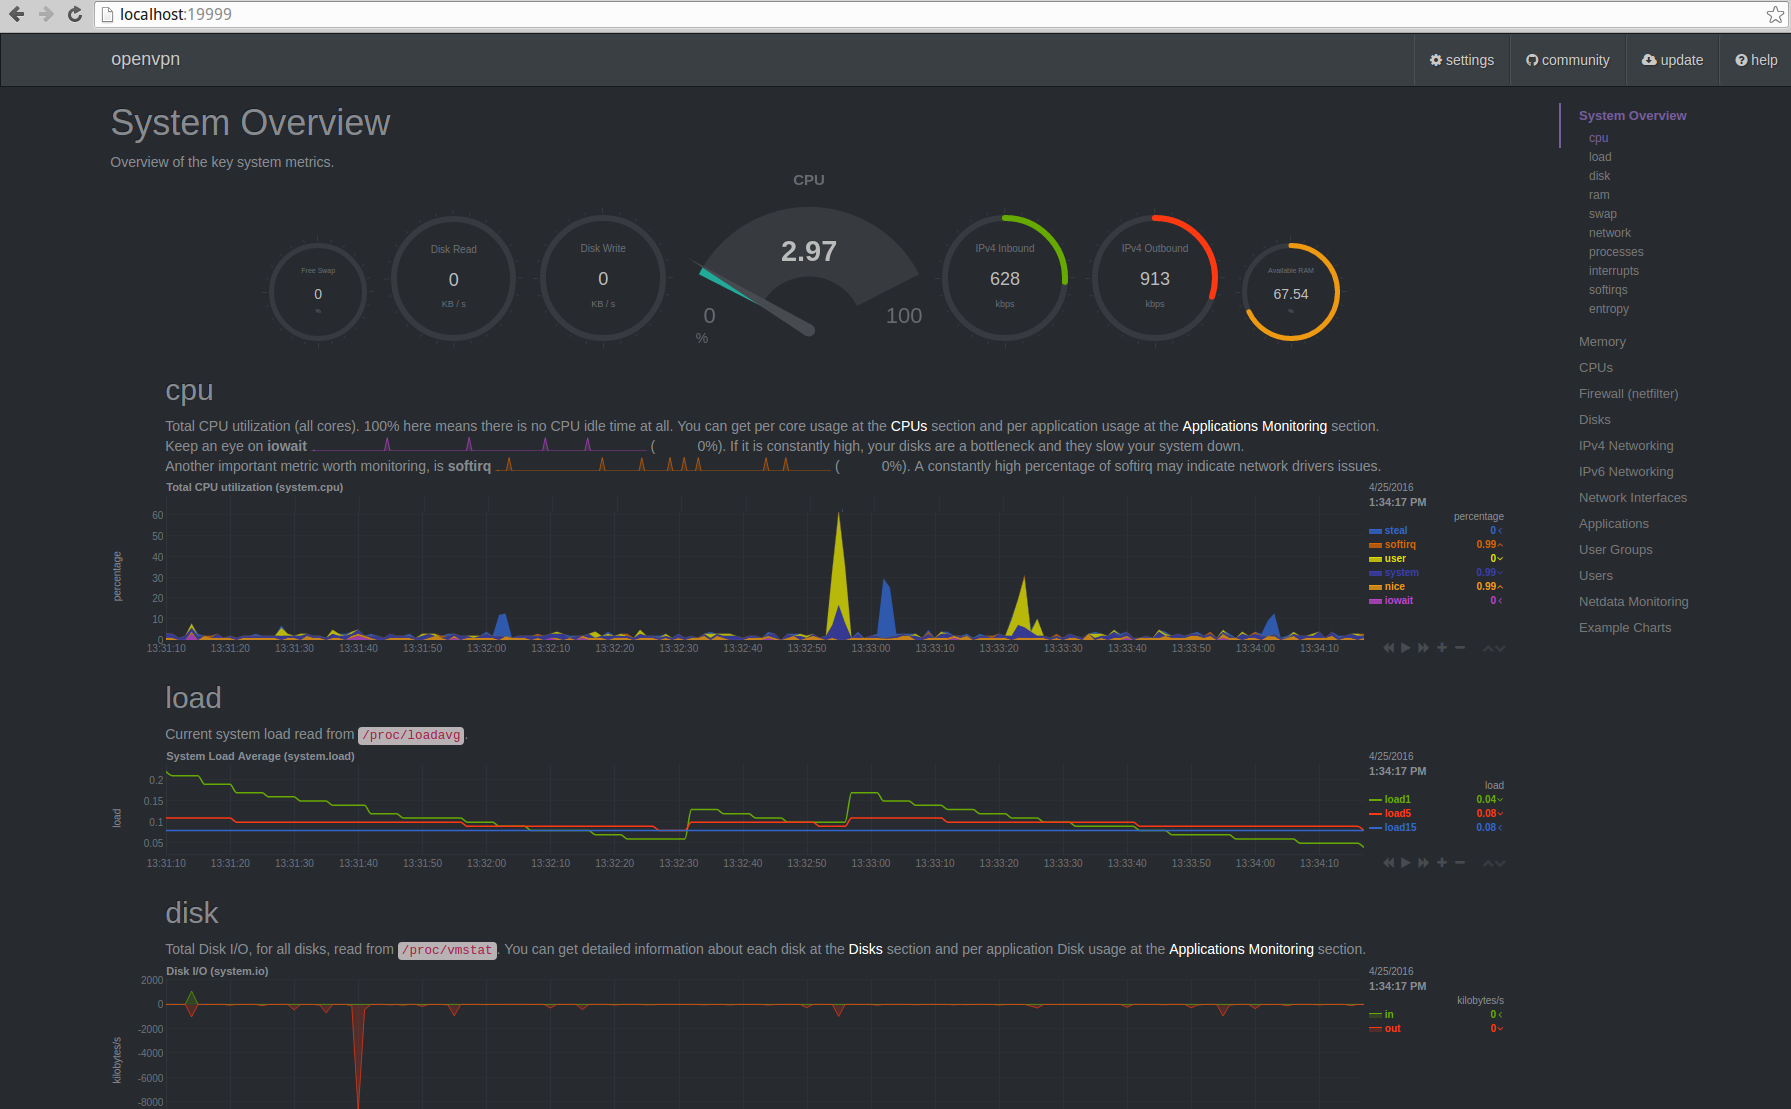
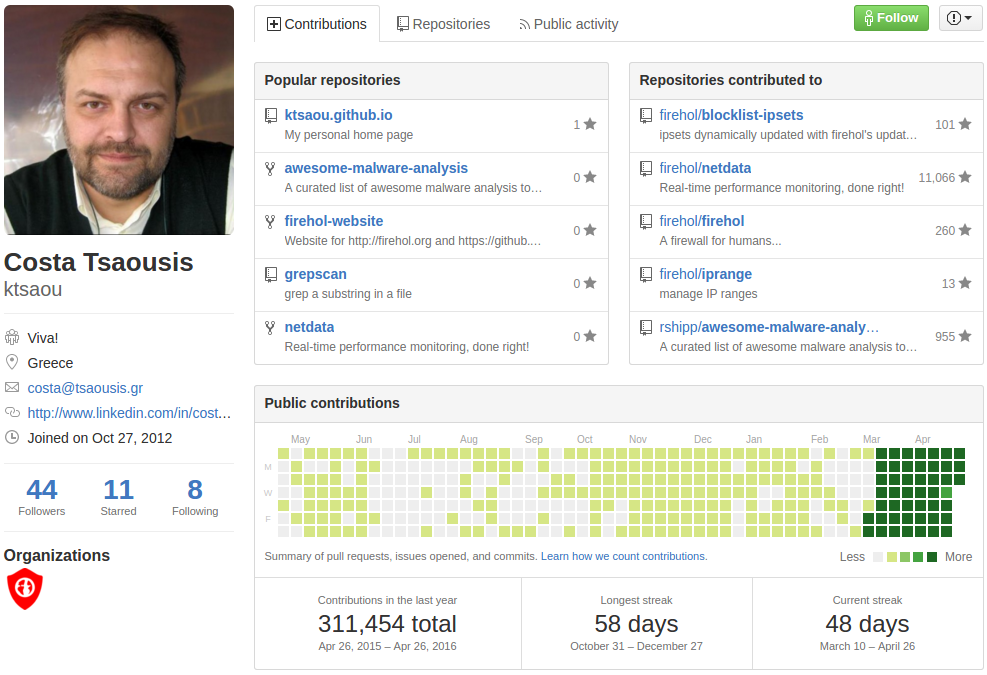
A good example of something that is likely to break in my setup these days, is Netdata. This project changes a lot on GitHub.
At some point, their installation script started to source some profile file that was, in some unconfigured instances of mine, running some ‘exec bash’. Moving netdata module inclusion after my shell role got applied was enough to fix.
More recently, their systemctl init script tells me Netdata can not start due some read-only file system. I finally had to replace their init, somehow.
Eventually, I may just patch my Ansible roles pulling Netdata from my own fork on GitHub.
Another sample of something that’s likely to break is NPMJS’s registry. Either for some package that disappeared due to internal quarrels, or their cache being likely to server 502 depending on your AWS region, or some nodejs module that got updated and some code that used to depend on it can not load the newer version, …
Preventing such errors – or spotting them as soon as possible – is crucial, when your setup relies on disposable instances that should auto-configure themselves on boot.
Which brings us to our main topic: CircleCI. I’ve been discussing this service on a former post, CircleCI is an easy way to keep an eye on your GitHub repositories.

CircleCI configuration running Ansible
CircleCI default image is some Ubuntu Precise on steroids, pretty much everything that exists in official or popular repositories would be installed, you’ld be able to pick your NodeJS, Python, Ruby, … versions. And lately, I’ve noticed that we’re even able to use Docker.
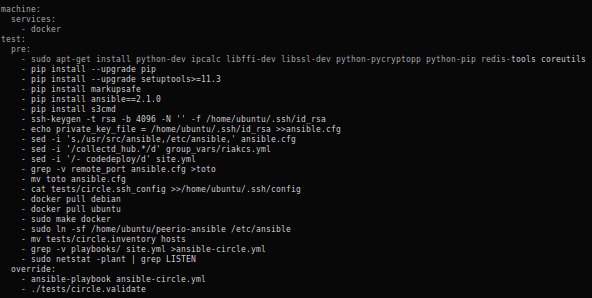
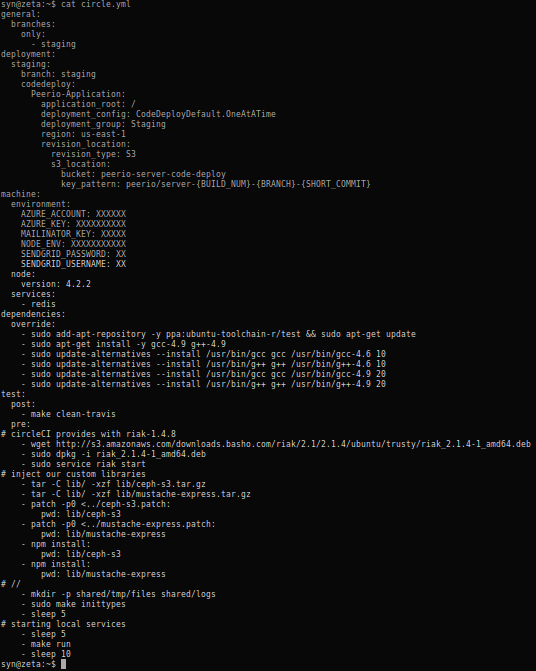
As usual, a very short circle.yml is enough to get us started.

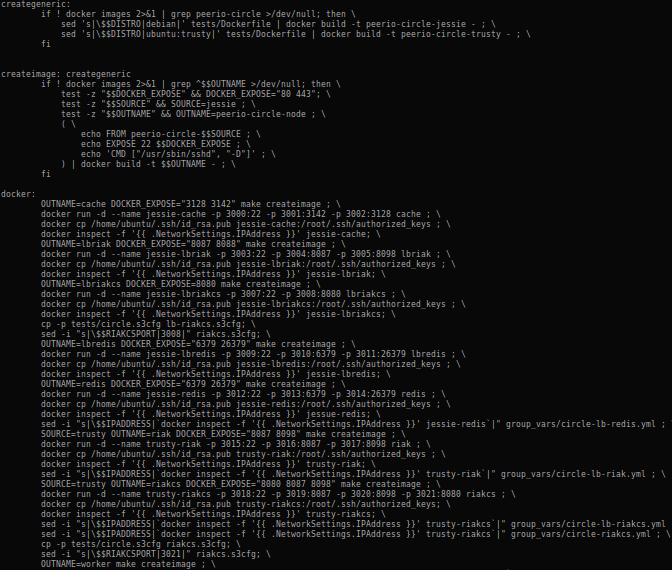
Makefile rules spawning docker containers
Note that our docker containers are started from a Makefile, which makes it easier to use colons, mapping internal to external ports (colons being a Yaml delimiter).
We also add our own ~/.ssh/config, so our Ansible inventory can refer to hostnames instead of several occurrences of 127.0.0.1 with different client ports. Somehow, the latter seems to disturb Ansible.
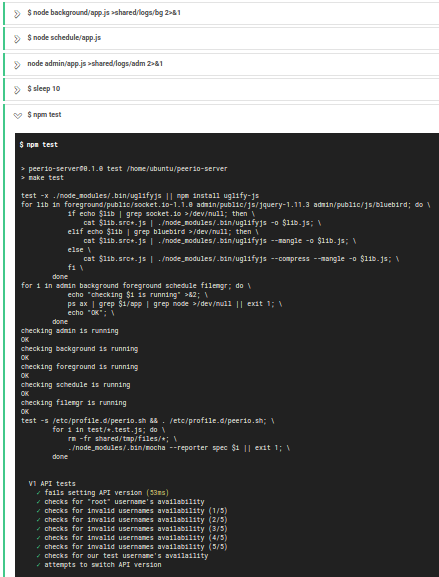
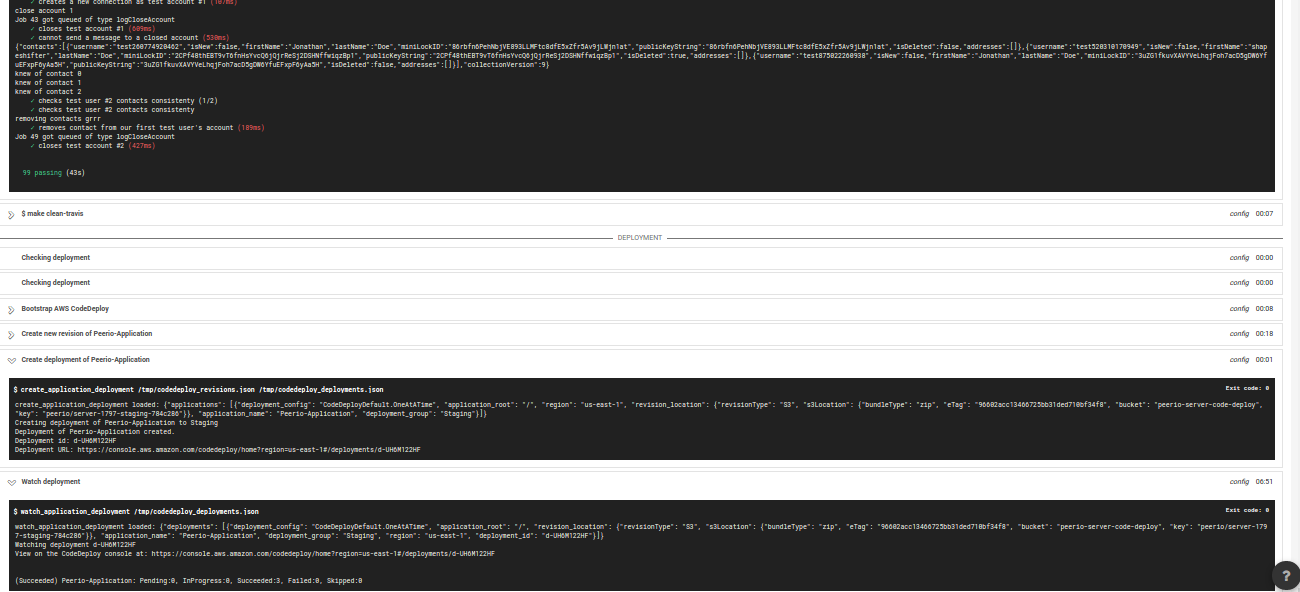
CircleCI applying our Ansible cuisine
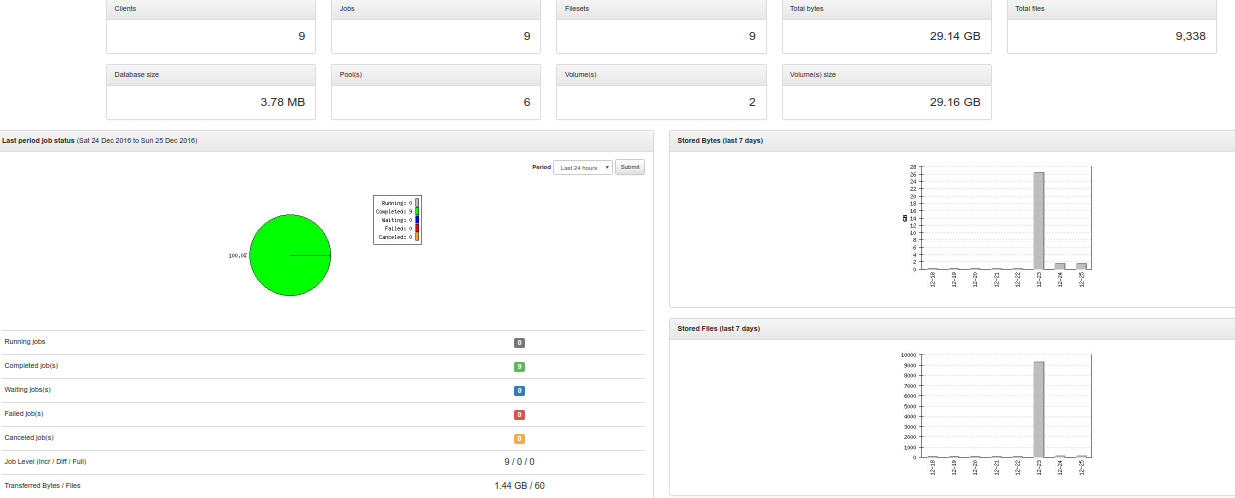
Our current configuration would start 9 instances, allowing us to apply our ansible roles against different configurations (riak node, redis node, loadbalancer, nodejs worker, …).
The whole process, from CircleCI instance start to our nine docker containers being configured, then running a few checks ensuring our services behave as expected, takes about 25 minutes. Bearing in mind CircleCI free plans usually won’t let you run your tests for more than 30 minutes.
Note that from time to time, installing your packages from httpredir.debian.org would end up in connections getting closed, and some of your images may fail building. I’m not sure yet how to address these.
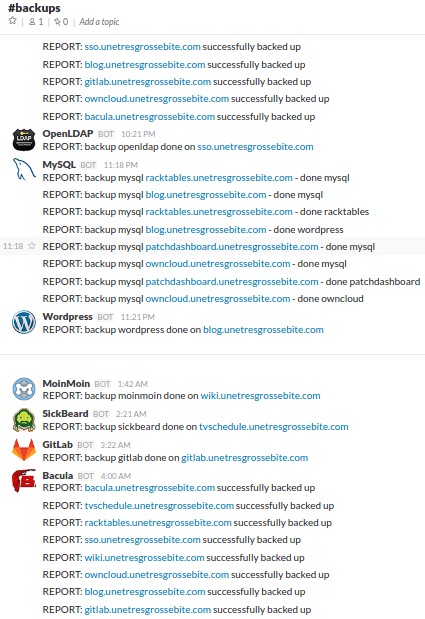
I would also like to expose nagios & munin ports, having CircleCI running checks as our internal monitoring would have done. Still, we’re already running a few wgets, redis and s3cmd based verifications, making sure our main services are behaving as expected.
Now I should say I’m usually skeptical regarding Docker relevance, as I’m mostly dealing with production setups. I’ve been testing Docker a few times on laptops, without being much impressed – sure, the filesystem layers thing is kind of nice. Then again, I’m more likely to trust Xen’s para-virtualization these days.

It’s not stupid at all! Pinkerton, you explain the logic and I’ll provide the background
Eventually, I ended up installing Docker on some KVM guest I use building Debian & Ubuntu source packages.
Running Docker on CircleCI felt like an obvious thing to do – and you probably already have heard of someone using Docker in conjunction with Jenkins or whatever CI chain.
I wouldn’t recommend nesting virtualization technologies, although this may be one of the rare cases such practice won’t potentially hurt your production, while helping you in ensuring your deployment cuisine actually does what you’re expecting of it, whatever service you would be deploying.